| REQUIRED USER ROLE Administrator, Team Manager, or Analyst |
Use the Topics dashboard to analyze how Topics are used across Conversations, how often they are applied, and more.
Imagine this. Suppose you have “Returns” as a Topic. The Topics Dashboard can quickly show any sudden increase in Conversations where “Returns” is applied or trending as one of the most applied Topics. This signals you to investigate which items are seeing a rise in returns and to comprehend the reason behind it.
While considered historical reporting because reported data is an hour behind, it’s an effective tool for generating data-backed insights and investigations.
Before you start #
We recommend you review the following before using any OOTB dashboards.
- Get a complete overview of the OOTB Dashboards.
- Load the dashboard after choosing your filters to get the latest data by clicking the green load icon.
- Get familiar with Time Anchors. Every report tile in the dashboard uses a specific time anchor to aggregate data, so you must understand how this concept is utilized.
- Look for trends to understand how the use of specific Topics changes over time.
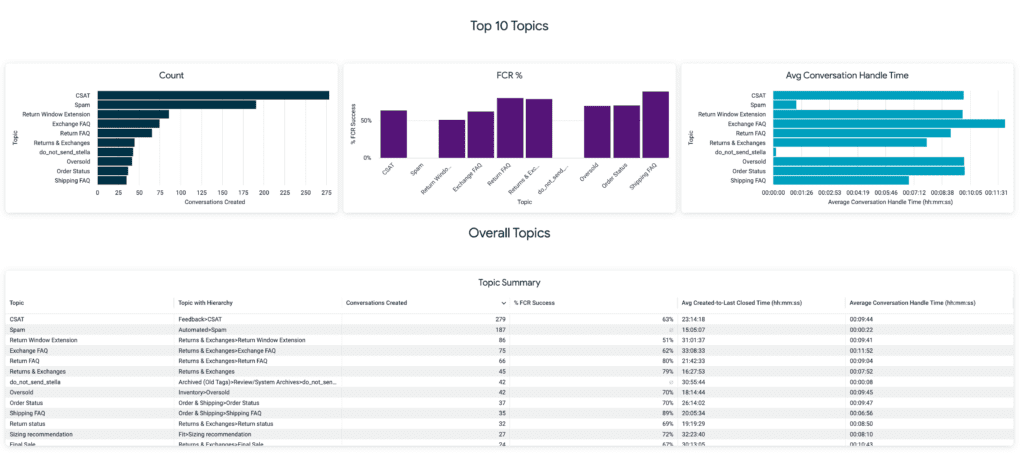
- Tiles display the top 10 Topics. Use the Overall Topics section in the dashboard to view more Topics.
Access the Topics dashboard #
- Click
on the top left corner of the screen.
- Click Reports.
- Under the Conversations category, click Topics Dashboard.
- Update your filters.
- Note – Aside from the ones in each dashboard, no additional filters are available.
- Click the green Load button on the top right corner of the dashboard to refresh dashboard data bounded by the filter.

- Note – After the initial dashboard load, the load button changes to a refresh icon.

- Note – After the initial dashboard load, the load button changes to a refresh icon.
If you change the filter, click the refresh icon again to reload the dashboard.
Topics Dashboard tiles #
The table below details each report tile available in the Topics Dashboard.
| Tile Name | Metric Used | Time Anchor | Description | Inbox Filter | Channel Filter | Comments | Also Available In |
|---|---|---|---|---|---|---|---|
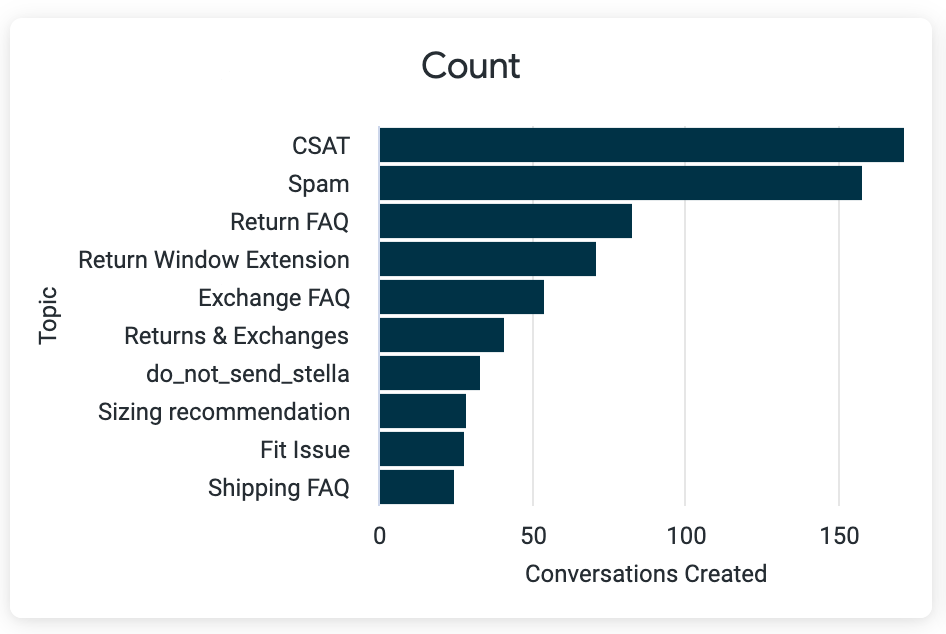
| Count | Conversations Created | Conversation Last Closed At | Count the number of Conversations a Topic was applied minus the number of times a Topic was removed within the specified time range. | Inbox when Created | First Channel | Limited to top 10 Topics | n/a |
| FCR % | % FCR Success | Conversation Last Closed At | Topics that were successful First Contact Resolution. | Inbox when Last Closed | First Channel | Limited to top 10 Topics | |
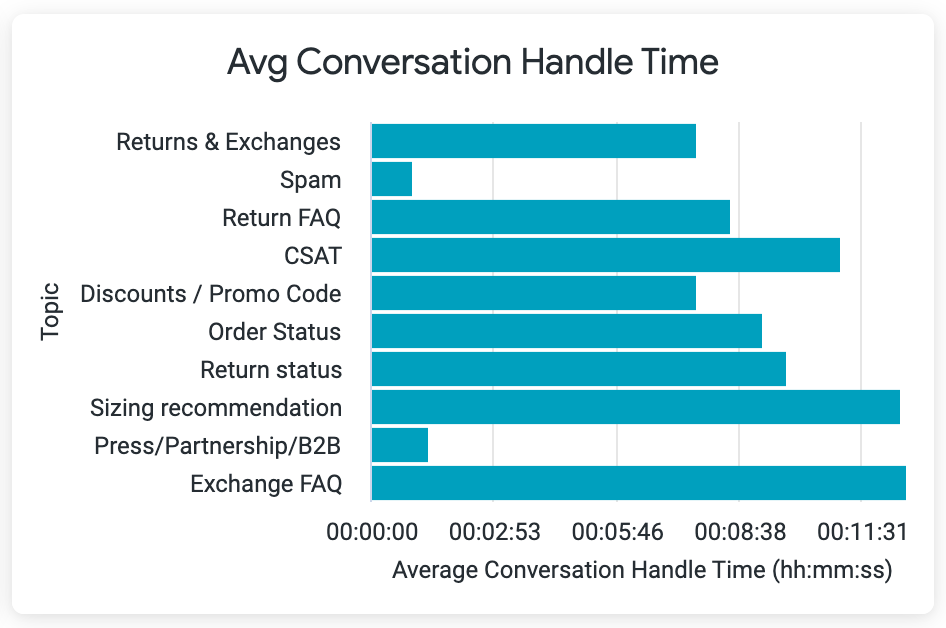
| Avg Conversation Handle Time | Average Conversation Handle Time | Conversation Last Closed At | Average duration of time spent by any Agent on the Customer Profile with the applied Topic while the Conversation is open. | Inbox when Last Closed | First Channel | Limited to top 10 Topics | n/a |
| Overall Topics | Non-constrained list (i.e., top 10) of Topics listed by metric. |
Sample Topics Dashboard use cases #
Gain perspective on how to use the Topics dashboard to drive action. Let’s look at three examples using the report tiles below.
Count

Imagine that you typically see sub-50 Conversations where Spam Topic is applied but suddenly notice a two- to three-time increase in Conversations seen as spam. Use this data to research the types of spam communications your contact center is receiving and formulate a plan (e.g., create spam Rules) to reduce or deflect the number of Conversations seen as spam.
Avg Conversation Handle Time

Suppose you work for a direct-to-consumer company and notice that Conversations, where the Topic Returns & Exchanges are applied, are taking longer to resolve compared to past weeks. This could suggest possible issues with a product seeing an increase in returns, but it could also signal issues with the returns process itself.
Overall Topics

Because the Topics dashboard tiles only reflect the top 10 Topics, the Overall Topics (or Topics Summary) is a great way to look at Topics’ performance holistically. It shows how many Conversations used a particular Topic/Topic With Hierarchy and measures them against performance metrics like %FCR.


