| REQUIRED USER ROLE Administrator, Team Manager, or Analyst |
| Connect Learning Available in eLearning format in Connect Learning. |
Use the Coaching Dashboard to do performance and improvement opportunity reviews with Agents. While considered historical reporting because reported data is an hour behind, it’s an effective tool to help you make data-backed feedback for Agents.
Curated specifically with Agent performance in mind, each report tile in the Coaching Dashboard allows people managers to focus on individual strengths and areas of opportunity.
Before you start #
We recommend you review the following before using any OOTB dashboards.
- Get a complete overview of the OOTB Dashboards.
- Load the dashboard after choosing your filters to get the latest data.
- Get familiar with Time Anchors. Every report tile in the dashboard uses a specific time anchor to aggregate data, so it’s important that you understand how this concept is utilized.
Access the Daily Trends dashboard #
- Click
on the top left corner of the screen.
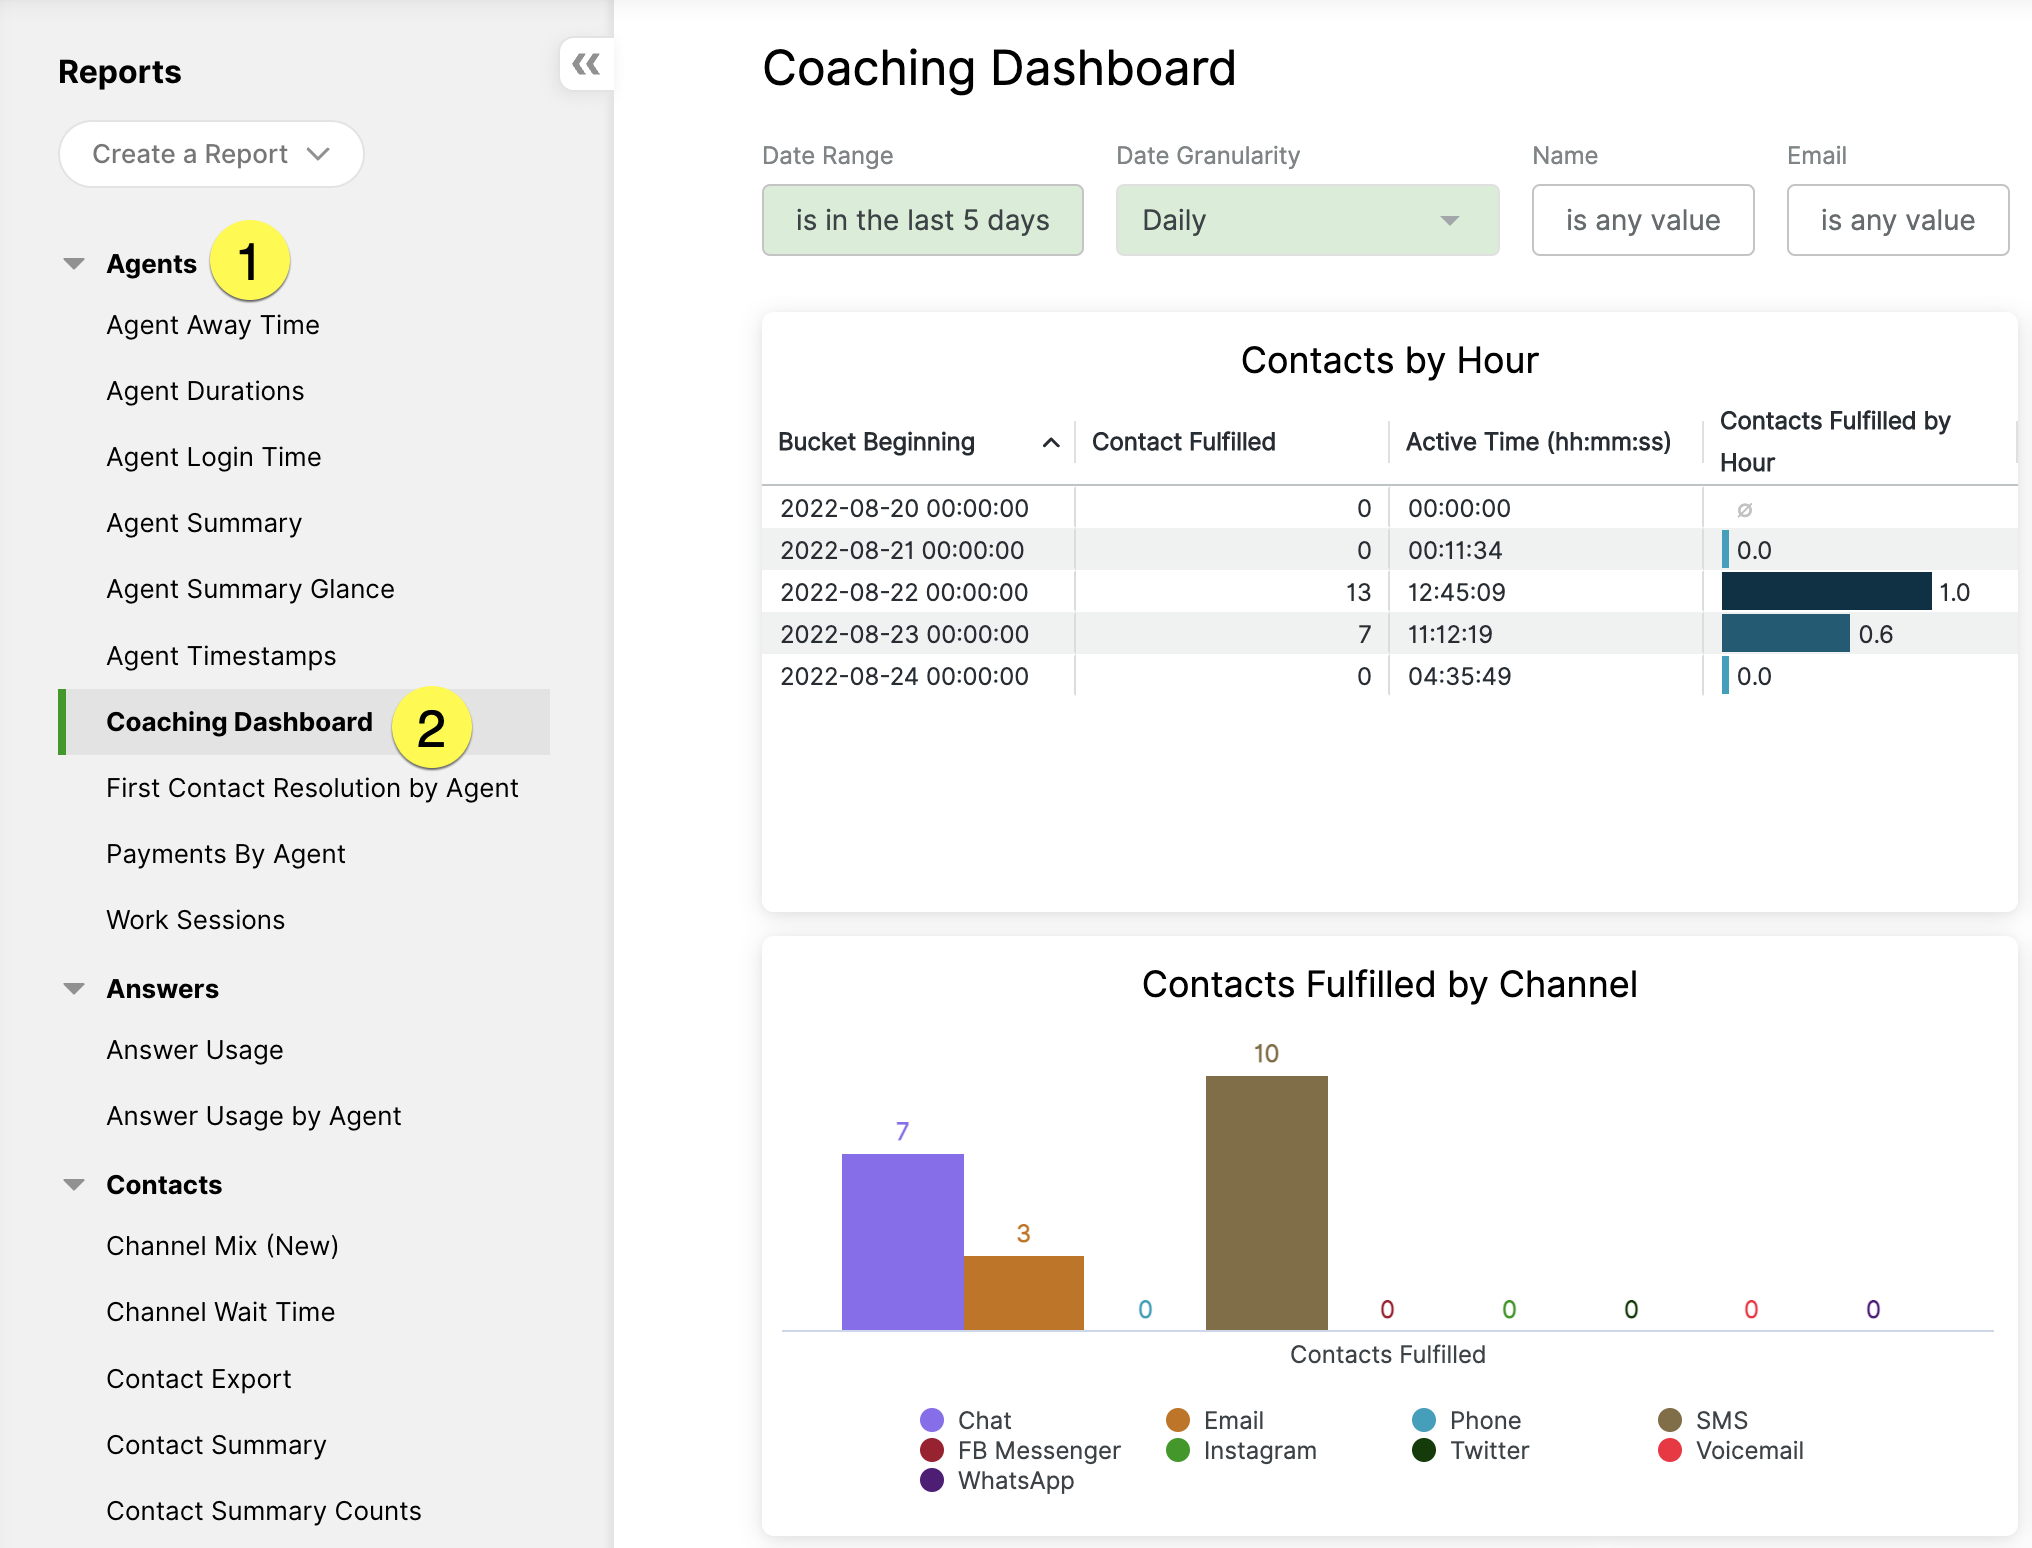
- Click Reports.
- Under the Agents category, click Coaching Dashboard.

- Set the dashboard filters.
- Note – No additional filters are available aside from the ones available in each dashboard.
- Click the green Load button on the top right corner of the dashboard to refresh dashboard data bounded by the filter.

- Note – After the initial dashboard load, the Load button changes to a Refresh icon.

- Note – After the initial dashboard load, the Load button changes to a Refresh icon.
If you change the filter, click the refresh again to reload the dashboard.
Coaching Dashboard tiles #
The table below details each report tile available in the Coaching Dashboard.
| Tile Name | Metric Used | Description | Also available in |
|---|---|---|---|
| Contacts by Hour | Bucket Beginning | Beginning timestamp of the time grain (daily, weekly, etc.) chosen. | |
| Contacts by Hour | Contact Fulfilled | Count of times the Agent fulfilled a Contact. | Agent Summary |
| Contacts by Hour | Active Time | Duration of time the Agent was logged in and Active (not Away) in Gladly during the specified window. | Agent Summary |
| Contacts by Hour | Contacts Fulfilled by Hour | Ratio of “Contact Fulfilled” divided by “Active Time” for the given time bucket. | |
| Contacts Missed by Channel* | Contact Missed | Count of times the Agent missed an offered Contact. | Agent Summary |
| Contacts Missed by Channel* | Channel | Channel of the Contact. | |
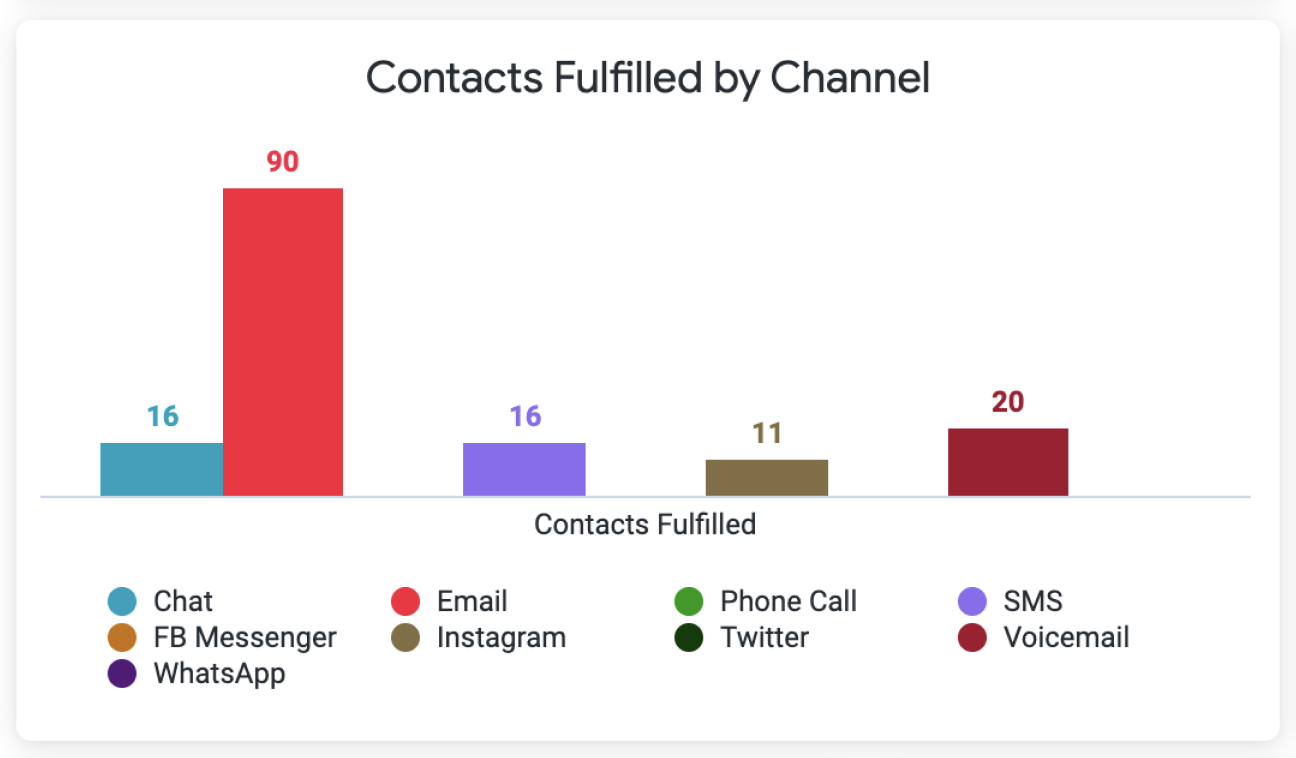
| Contacts Fulfilled by Channel | Contacts Fulfilled | Count of times the Agent fulfilled a Contact. | Agent Summary |
| Contacts Fulfilled by Channel | Channel | Channel of the Contact. | |
| Contacts Declined by Channel | Contact Declined | Count of times the Agent declined an offered Contact. | Agent Summary |
| Contacts Declined by Channel* | Channel | Channel of the Contact. | Agent Summary |
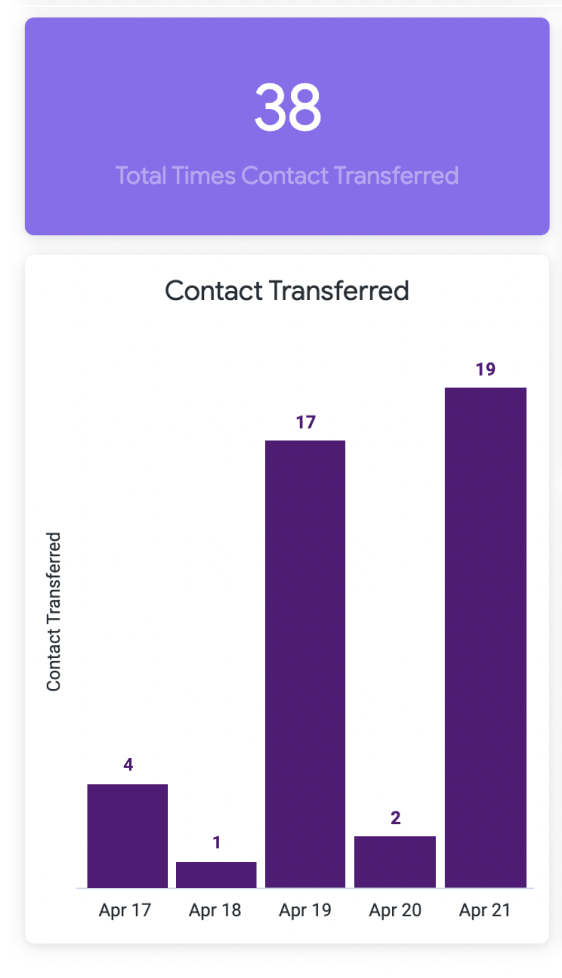
| Total Times Contact Transferred | Contact Transferred | Count of times the Agent transferred a Contact. | Agent Summary |
| Contact Transferred | Contact Transferred | Count of times the Agent transferred a Contact. | Agent Summary |
| Active, Away, and Logged In Time | Active Time | Duration of time the Agent was logged in and Active (not Away) in Gladly during the specified window. | Agent Summary |
| Active, Away, and Logged In Time | Away Time | Duration of time the Agent was logged in and Away in Gladly during the specified window. | Agent Summary |
| Active, Away, and Logged In Time | Logged In Time | Duration of time the Agent was logged in to Gladly during the specified window. | Agent Summary |
| Available Time | Available Time – Any | Duration of time the Agent was available for any channel type during the specified window. This will not double count the time the Agent was available for multiple channel types at the same time. | Agent Summary |
| Available Time | Available Time – Voice | Duration of time the Agent was available for Voice during the specified window. | Agent Summary |
| Available Time | Available Time – Messaging | Duration of time the Agent was available for Messaging during the specified window. | Agent Summary |
| Available Time | Available Time – Mail | Duration of time the Agent was available for Mail during the specified window. | Agent Summary |
| Occupancy | Occupied % | Average percentage of time that Agents are actively engaged in handling Customer interactions, such as calls, chats, or emails, compared to the total available time. Occupancy % may exceed 100% if Focus is not activated. | Agent Summary |
Sample Coaching Dashboard use cases #
Gain perspective on using the Coaching Dashboard as part of your performance evaluation toolbox. Let’s look at three examples using the report tiles below.
Active, Away, and Logged In Time
There are many ways to look at this report tile. For example, it can track schedule adherence or see anomalies compared to an Agent’s schedule. You can see if a particular Agent is taking the proper amount of breaks (Away time), and you may notice another Agent taking less or more than they should. It can also be used to see if they are staying Active for hours or if they should be available to receive Customers to help.
Contacts Fulfilled by Channel

Is a particular Agent doing well in working on Customer requests from one Channel but has an opportunity to do better on another? This is a great report to see those statistics to start the discussion. You can combine this insight with another report tile like Contacts by Hour.
Contact Transferred

Is an Agent transferring Contacts more (e.g., phone calls) than other Agents? Are they transferring Contacts because they don’t know how to answer Customer questions or solve the issue (when they should be able to), so they transfer the Contact? This report can help.


