| REQUIRED USER ROLE Administrator, Team Manager, or Analyst |
Use the Daily Trends dashboard to monitor or glance at how your contact center is doing by viewing key success and performance metrics. While considered historical reporting because reported data is an hour behind, it’s an efficient and effective tool for making data-backed action.
Imagine walking into your contact center for the day; you can use the Daily Trends dashboard to see how the team performed for the previous day. You can even look back an entire week to gauge how your team’s performance is trending.
Before you start #
We recommend you review the following before using any OOTB dashboards.
- Get a complete overview of the OOTB Dashboards.
- Load the dashboard after choosing your filters to get the latest data by clicking the green Load icon.
- Get familiar with Time Anchors. Every report tile in the dashboard uses a specific time anchor to aggregate data, so it’s important that you understand how this concept is utilized.
Access the Daily Trends dashboard #
- Click
on the top left corner of the screen.
- Click Reports.
- Under the Conversations category, click Daily Trends.
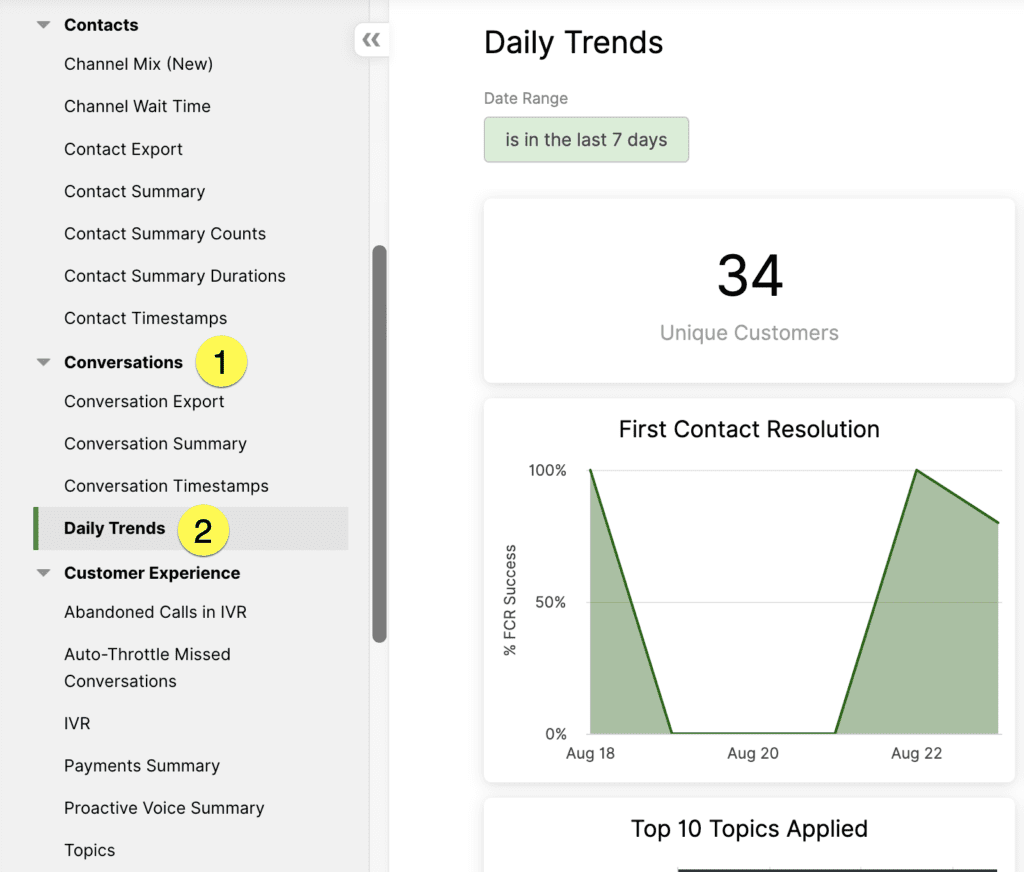
4. Update your filter.
- Note – Aside from the ones available in each dashboard, no additional filters are available.
5. Click the green Load button on the top right corner of the dashboard to refresh dashboard data bounded by the filter.

- Note – After the initial dashboard load, the Load button changes to a refresh icon.

If you change the filter, click the refresh icon again to reload the dashboard.
Daily Trends dashboard tiles #
The table below details each report tile available in the Daily Trends dashboard.
| Tile Name | Metric Used | Time Anchor | Description | Inbox Filter | Channel Filter | Comments | Also Available In |
|---|---|---|---|---|---|---|---|
| Unique Customers | Unique Customers | Conversation Created At | Count of unique Customers with Conversations. | Inbox when Created | First Channel | Conversation Summary | |
| First Contact Resolution | % FCR Success | Conversation Last Closed At | Conversations that were successful First Contact Resolution divided by Conversations that were eligible for FCR. | Inbox when Last Closed | First Channel | Learn more detail about how FCR is calculated. | Conversation Summary |
| Conversations Created | Conversations Created | Conversation Last Closed At | Count of Conversations created. | Inbox when Created | First Channel | ||
| Conversations Closed | Conversations Created | Conversation Last Closed At | Count of Conversations closed. | Inbox when Last Closed | First Channel | When comparing values for Conversation Closed over different periods (such as one week versus two weeks), values are expected to be different. This is because it is not a static count, but rather the number of times a Conversation was created within the time range, and the last time the Conversation was closed” | Conversation Summary |
| Top 10 Topics Applied | Topics Applied | Conversation Last Closed At | Count of the number of times a Topic was applied minus the number of times a Topic was removed within the specified time range. | Inbox when Last Closed | First Channel | Can be aggregated from Conversation Timestamps | |
| Conversation Handle Time | Average Conversation Handle Time | Conversation Last Closed At | Average duration of time spent by any Agent on the Customer Profile while the Conversation is open. | Inbox when Last Closed | First Channel | Learn more detail about how Handle Time is calculated. | Conversation Summary |
| Conversation Close Time | Avg Close Time | Conversation Last Closed At | Average duration of time from when the Conversation was created to when it was last closed. | Inbox when Last Closed | First Channel | Conversation Summary | |
| Service Level | Service Level % | Contact Ended At | Count of Contacts Fulfilled before SLA, divided by the sum of (Contacts Abandoned + Contacts Fulfilled). | Inbox when Contact Ended | Contact Channel | For inbound Contacts only. | Contact Summary |
| Service Level with Business Hours | Channel | Contact Ended At | Channel of the Contact. | Inbox when Contact Ended | Contact Channel | Reflects 24-hour operation if primary operating hours in SLA Business Hours is not set. | Contact Summary |
| Service Level Trending within Business Hours | Service Level % | Contact Ended At | Count of Contacts Fulfilled before SLA, divided by the sum of (Contacts Abandoned + Contacts Fulfilled). | Inbox when Contact Ended | Contact Channel | – For inbound Contacts only. – Reflects 24-hour operation if primary operating hours in SLA Business Hours is not set. | Contact Summary |
| Service Level Trending | Channel | Contact Ended At | Channel of the Contact. | Inbox when Contact Ended | Contact Channel | Contact Summary | |
| Channel Mix | Contacts Inbound | Contact Queued At | Count of inbound Contacts in that Channel that were queued. | Inbox when Contact Queued | Contact Channel | “Inbound” Contacts are those initiated by the Customer, Internal, or External Initiator Types. | Channel Mix (New), Contact Summary |
| Channel Mix | % of Inbound Contacts | Contact Queued At | Count of inbound Contacts in that Channel divided by total inbound Contacts. | Inbox when Contact Queued | Contact Channel | Channel Mix (New) | |
| Channel Wait Time within Business Hours | Avg Queued-to-Fulfilled Time | Contact Ended At | Average duration of time from when the Contact was first queued to when it was fulfilled | Inbox when Contact Queued | Contact Channel | – For inbound Contacts only, and only for Fulfilled Contacts. – Reflects 24-hour operation if primary operating hours in SLA Business Hours is not set. | Channel Wait Time, Contact Summary |
Sample Daily Trends dashboard use cases #
Gain perspective on how to use the Daily Trends dashboard to drive action. Let’s look at three examples using the report tiles below.
Top 10 Topics Applied
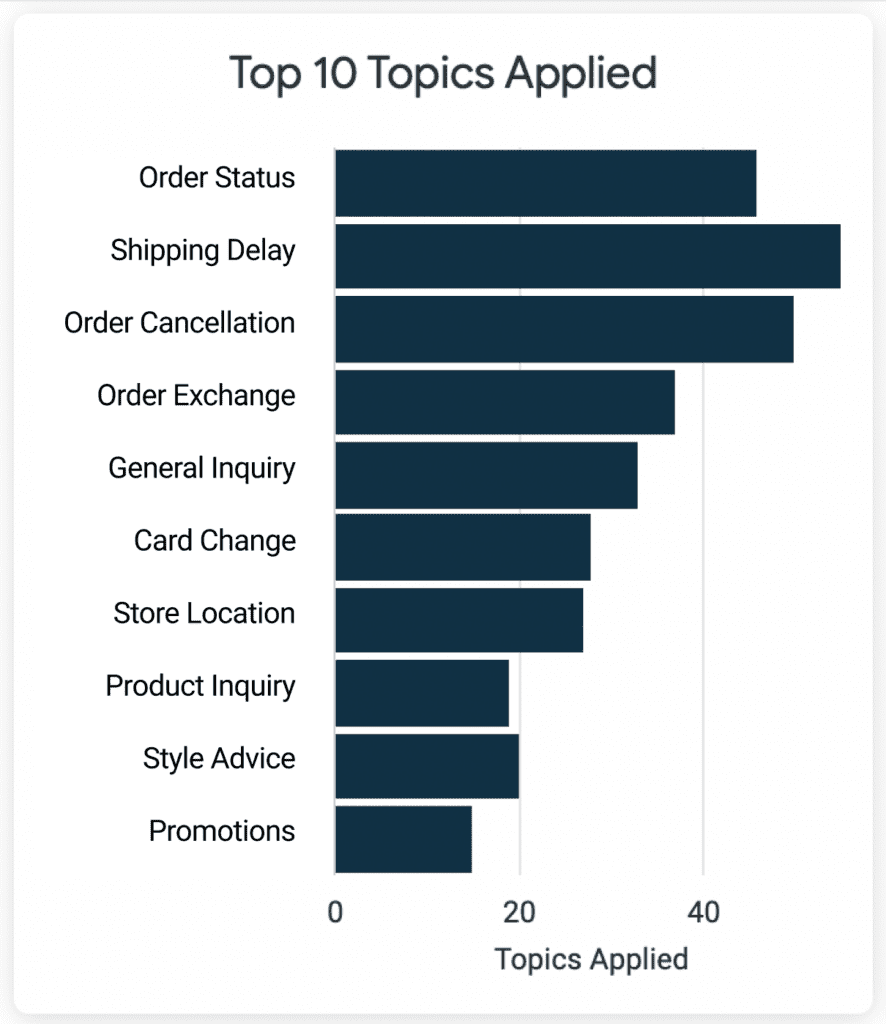
Suppose you run a retail company’s contact center and notice that Shipping Delay Topic is used a lot for the day. This may suggest a possible logistics issue, and you can use this information as a reason to investigate.
First Contact Resolution
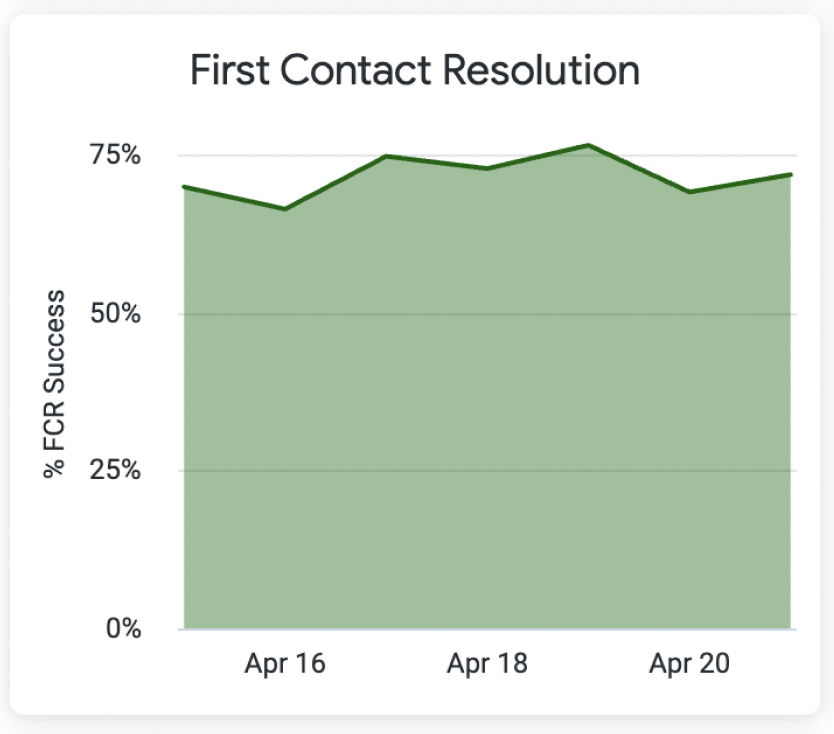
Let’s imagine that your contact center averages a First Contact Resolution (FCR) of 70% on a 7-day rolling basis based on your dashboard date filter, but you notice your FCR has dipped to 40%. Seeing this trend efficiently allows insight to investigate the cause properly. To see a correlation, you could also look at other dashboard report tiles like Conversation Handle Time, Channel Mix, and Topics.
Service Level Trending
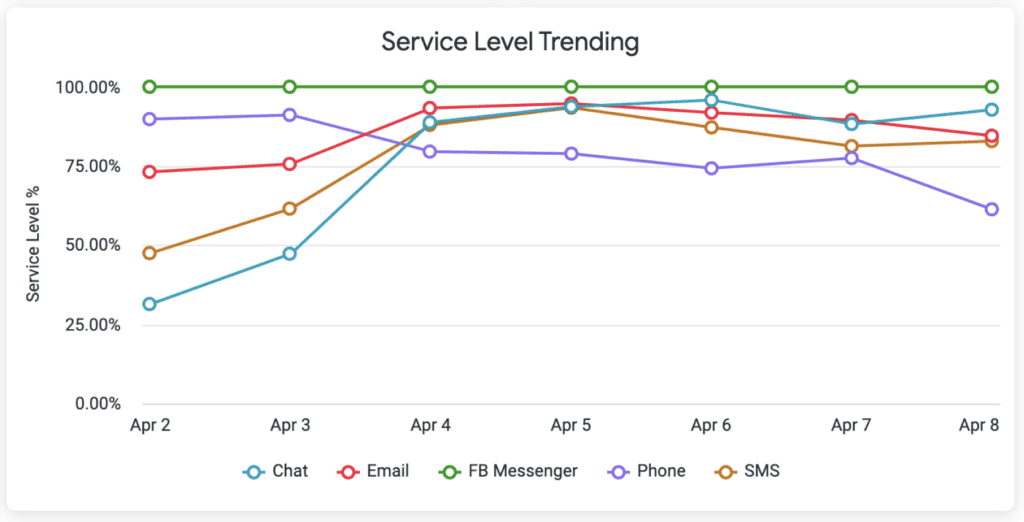
Let’s pretend that your contact center averages a Service Level Trending percentage for email of 75%. Depending on the dashboard date filter, you noticed this had trended closer to 95%. Why the improvement? Was there training on writing clearer and more detailed emails, reducing the need for follow-up emails? You may even compare this with other dashboard report tiles like Channel Wait Time.


