In addition to the reports you can view directly from Gladly, you can also export/download reports as a CSV from the UI. CSVs sometimes contain more metrics than what can be seen in the UI and is especially useful for users who want to dig deeper into how the contact center is performing.
CSV reports contain a lot of detail. It can be used in 3rd-party business intelligence tools that you might use. Just note that when downloading your report into a CSV file, the interval in the CSV selector will override the interval view on the report currently being viewed on-screen. Certain reports can contain up to 1 million rows in the CSV export. All others will have a 100k row limit.
Download report as a CSV #
- From the Reports page, select the report you need, select your filters, and then click View Report.
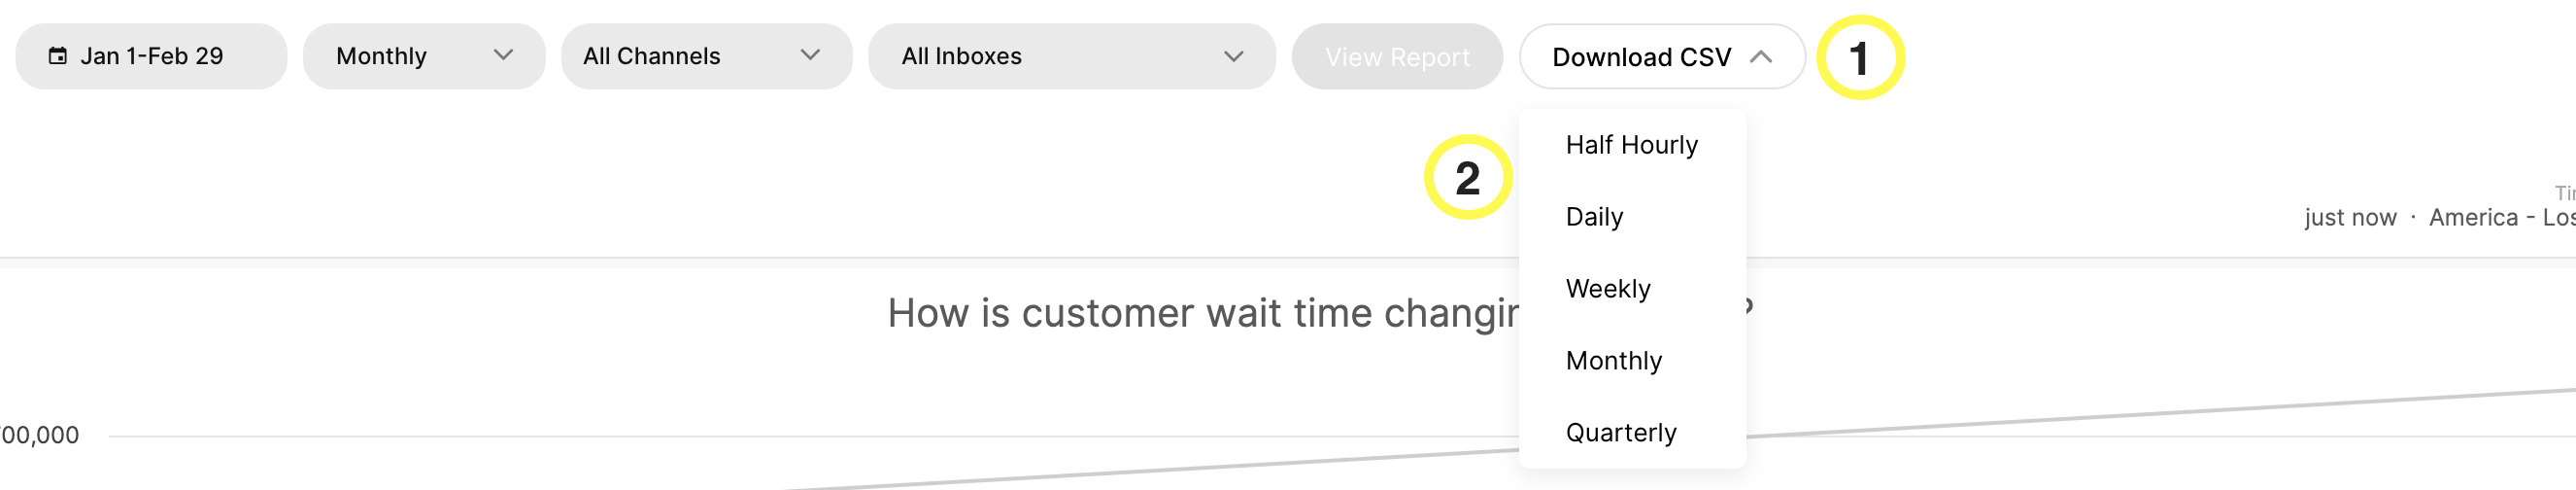
- Once your report is generated, select Download CSV.
- Choose how you want to aggregate your data in the CSV.
- Half Hourly
- Daily
- Weekly
- Monthly
- Quarterly
Wait a few moments to allow Gladly to generate the report. It should then download to your local download folder.
Additional download options (PDF and CSV) #
Some reports have additional formats for downloading. If available, click![]() to the right of the report, then select Download.
to the right of the report, then select Download.
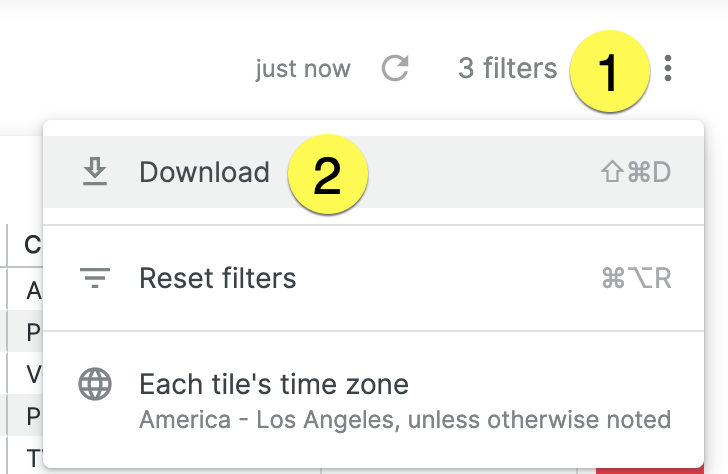
Here, you can download the report in CSV or PDF format. Downloading in PDF format provides you with additional options:
- Paper Size – The Fit Page to Dashboard option is the default; it sizes the PDF to match the layout of the dashboard on the screen. Other paper size options size the PDF to match a standard paper size and fit the dashboard. Depending on the layout of the dashboard, large visualizations or groups of overlapping tiles may need to be resized to fit on given page size.
- Expand tables to show all rows (check box) – If you select something other than Fit Page to Dashboard in the Paper Size drop-down, an Orientation option appears. You can choose to orient the dashboard in portrait or landscape position.
- Arrange dashboard tiles in a single column (check box) – Select or leave unselected Arrange dashboard tiles in a single column. If you select this option, the PDF displays dashboard tiles in a single vertical column. If you do not select this option, the dashboard tiles appear as they are arranged in the dashboard.
Access reports via API #
All reports in Gladly are accessible via the API. Visit the developer site ![]() to learn how to generate reports via API.
to learn how to generate reports via API.