| REQUIRED USER ROLE Administrator, Team Manager |
| Connect Learning Available in eLearning format in Connect Learning. |
Gladly offers many different types of reports that will help you answer questions related to the operation of your Customer Service Center. You can generate reports anytime you have a question.
Before you generate and review any reports, you must have a good understanding of Gladly Key Concepts. Knowing these Key Concepts will help you better comprehend the information presented in the reports.
Generate a Report #
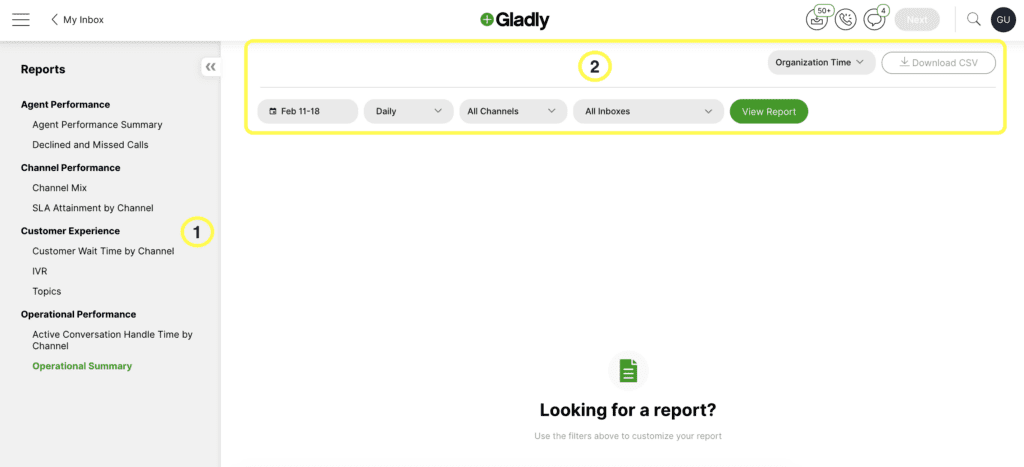
- Click
on the top left corner of the screen.
- Click Reports.
- From the Reports page, on the report selection list on the left side of the screen, find and select the report you want to generate.
- Use the filter options to specify exactly how you want to see the report. The filter types change based on the report you have selected.
- Date Range – Select a date range for the data you want to see:
- Last 7 days
- Last 14 days
- Last 28 days
- This week
- Last week
- This Month
- Last Month
- Custom range
- Aggregated View – Depending on your chosen date range, you can select different aggregated views of your data. For example, you can view your data daily, or if you choose a longer date range, view it by weekly, monthly, or even quarterly roll-ups. The aggregated view is also dependent on the date range you are using:
- Half-Hourly: 0 < days ≤ 31 days
- Daily: 0 < days ≤ 100 days
- Weekly: 7 ≤ days ≤ 700 days
- Monthly: 28 ≤ days ≤ 731 days
- Quarterly: 120 ≤ days ≤ 731 days
- Channel: Specify the Channels you want to filter by.

- Inbox – Choose to filter the report down to a specific Inbox.
- Teams – Choose to filter the report to a specific team.
- Timezone Selector – Select the timezone you want your report to be shown in. The default is Organization time (this filter is only available in Agent Performance Summary, Operational Summary, Topics, or IVR report).

Once you have your filters set, select View Report.
Data lag times #
You may notice that reports you generated via the Gladly UI or API don’t show the most recent data. This is because reports don’t reflect up-to-the-minute data. Reports generated via Gladly UI and API are one hour behind.
For example, let’s say you generated a report at 1:50 PM, and using half-hourly, you would only see data up until 12-12:30. The 12:30 to 1 PM increment hasn’t finished processing, so you wouldn’t see data for 12:50 in this scenario.
Switching between time zones on Reporting #
You can set your reports to display in any timezone you like.

Say, for example, your company is based in Boston (i.e., in the Eastern Time Zone), but you’re based in San Francisco (i.e., in the Pacific Time Zone). You’ll have the choice between viewing your reports in either time zone. This way, you can avoid some of the usual mental arithmetic involved when working across time zones.


