This page provides a library of commonly used reporting scenarios that can be built with Insight Builder. These “Report Recipes” make it easy for Analysts to create reports and dashboards or use them as a baseline to customize data further.
Before you start #
- Learn how to create reports with Insight Builder.
- Learn how to save reports to a dashboard.
- Learn how to add reports to an existing dashboard.
Agent Productivity #
Leverage data that indicates how efficiently your Agent teams are working in Gladly.
About the Recipe
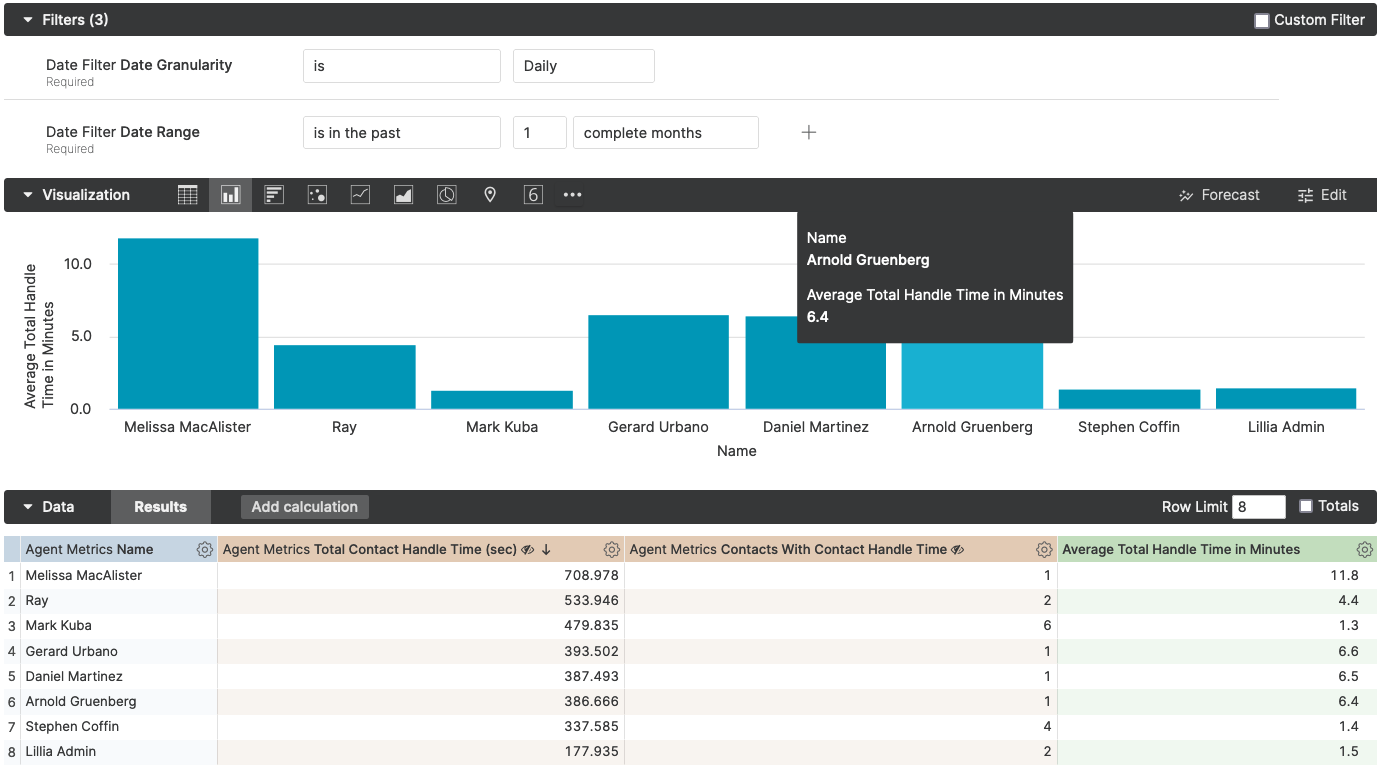
In this Insight Builder Report Recipe, you’ll learn how to report on the average Total Handle Time of your Agents. Total Handle Time is the total time spent working on an active contact, including associated After Contact Work for that Contact during the specified window.
Recipe Components
Dataset:
- Agent Metrics
Dimensions:
- Identity
- Name
Measures:
- Total Contact Handle Time (sec)
- Contacts with Contact Handle Time
- Custom Calculation
Method
Fields:
- From Reports, click the Create a Report dropdown.
- Select Agent Metrics.
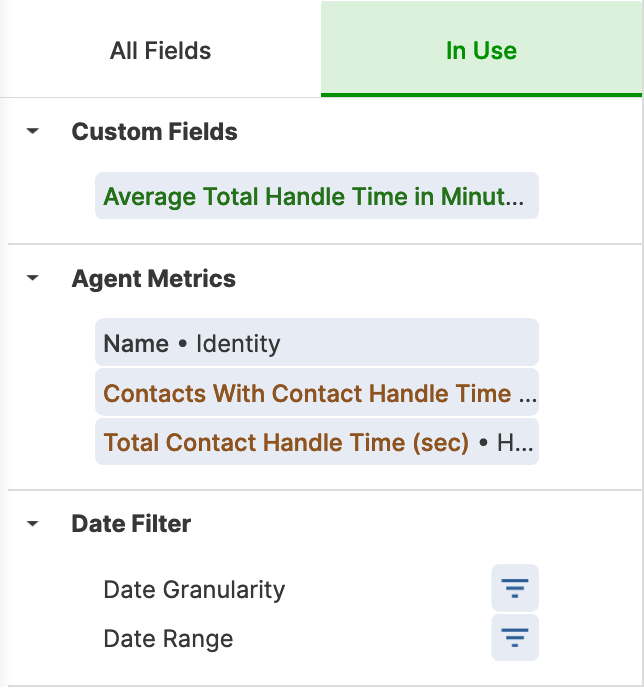
- Within All Fields, locate and add the following:
- Identity
- Name
- Total Contact Handle Time (sec)
- Contacts with Contact Handle Time
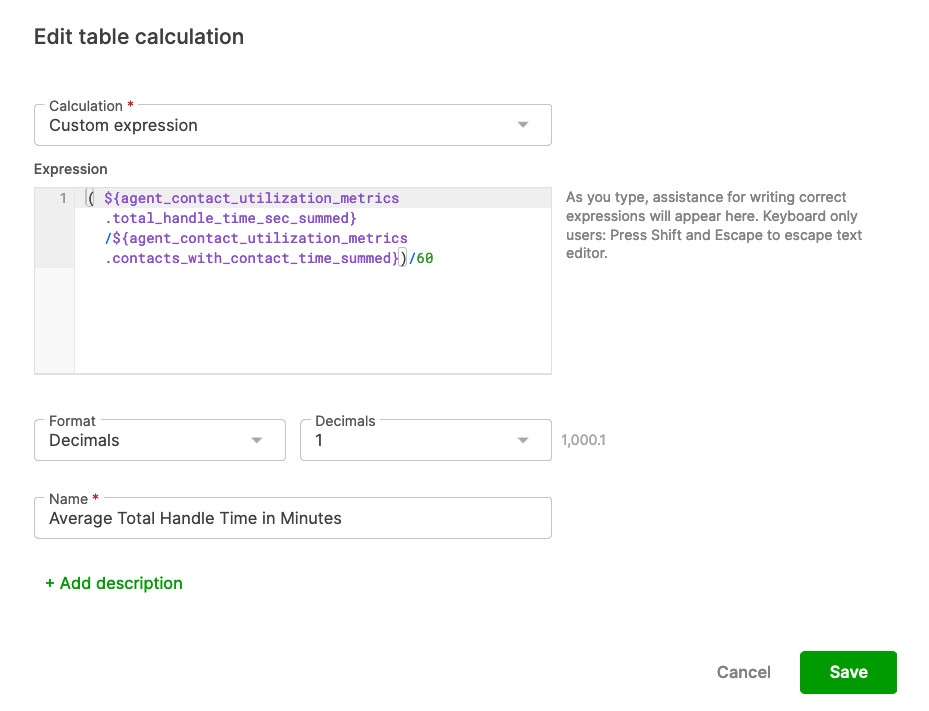
- Click Add Calculation
- In the Expression editor, enter the following calculation:(${agent_contact_utilization_metrics.total_handle_time_sec_summed}/${agent_contact_utilization_metrics.contacts_with_contact_time_summed})/60
- Enter the below information in the remaining fields:
- Format: Decimals
- Decimals: 1
- Name: Average Total Handle Time in Minutes

- Identity
Filters, Visualizations, and Data:
- In the Filters tab, update the filter as follows:
- Date Filter Date Range is in the past 1 complete weeks

- Date Filter Date Range is in the past 1 complete weeks
- In the Visualization tab, select the Column visual.

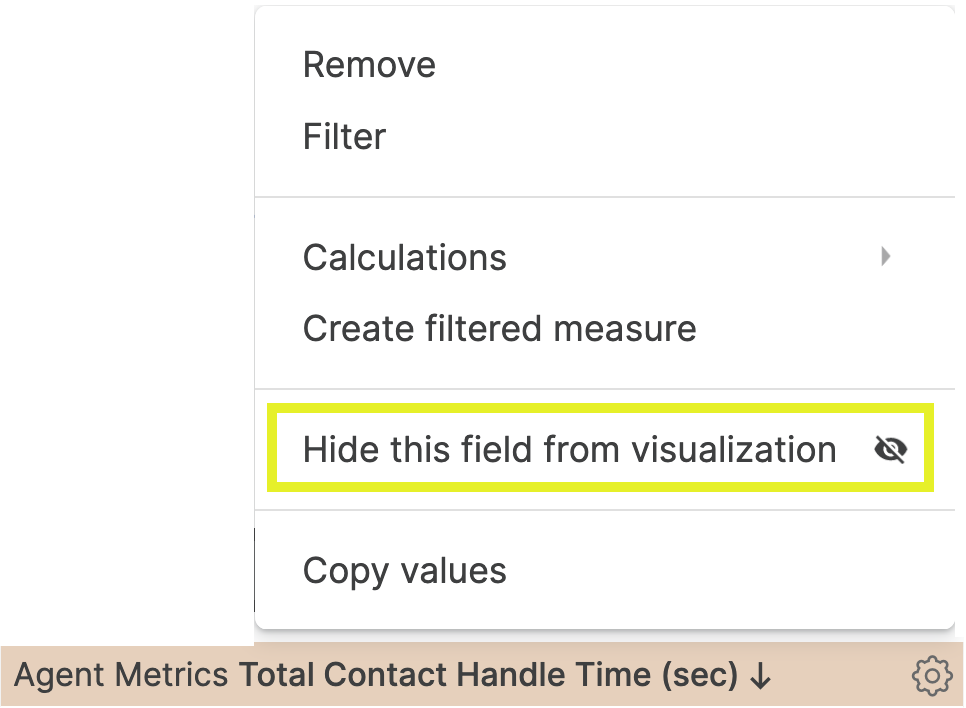
- In the Data tab, mark the following metrics as Hide this field from visualization:
- Total Contact Handle Time (sec)
- Contacts with Contact Handle Time

- Click Run.

About the Recipe
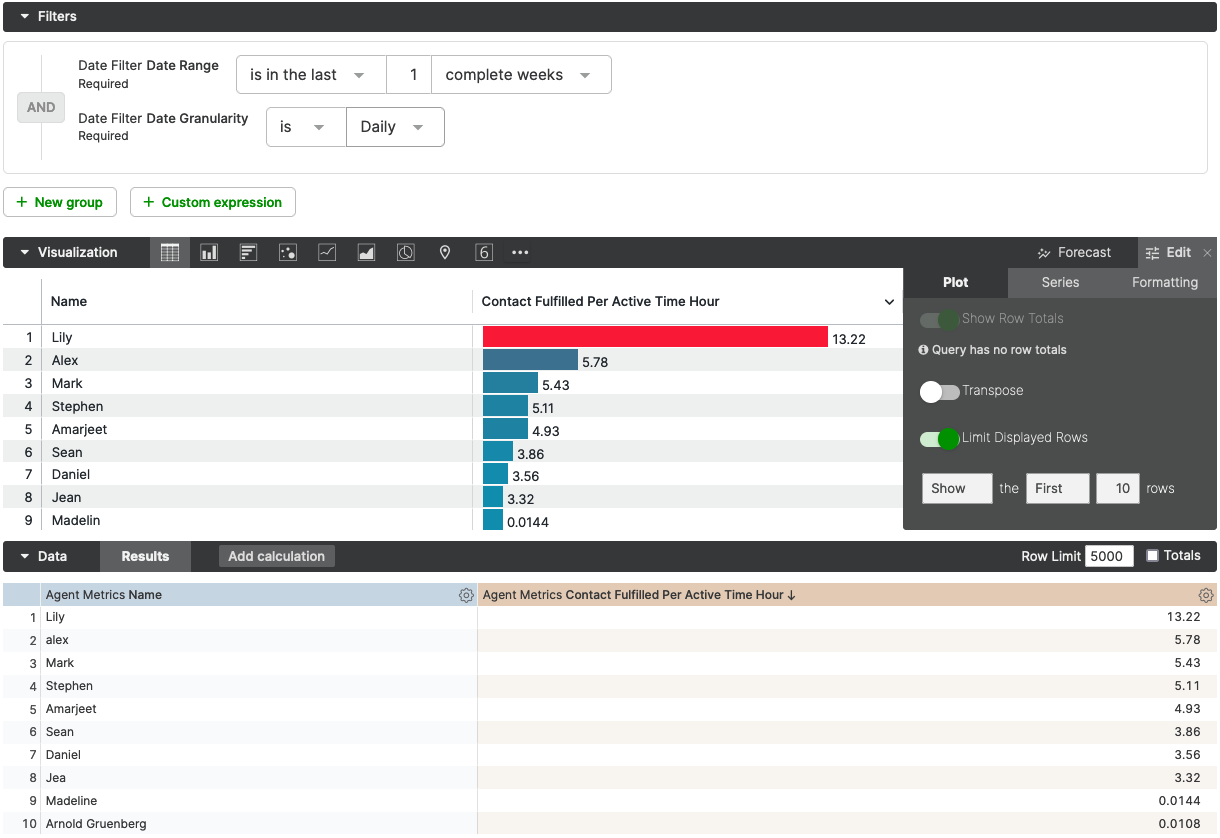
In this Insight Builder Report Recipe, you’ll learn how to report on the top and bottom contributors based on Contact fulfillment performance. This recipe will look at the top 10 and bottom 10 Contributors by the Contacts fulfilled per Active Time.
Recipe Components
Dataset:
- Agent Metrics
Dimensions:
- Identity
- Name
Measures:
- Contacts Fulfilled
- Contact Fulfilled Per Active Time Hour
Method
Fields:
- From Reports, click the Create a Report dropdown.
- Select Agent Metrics.
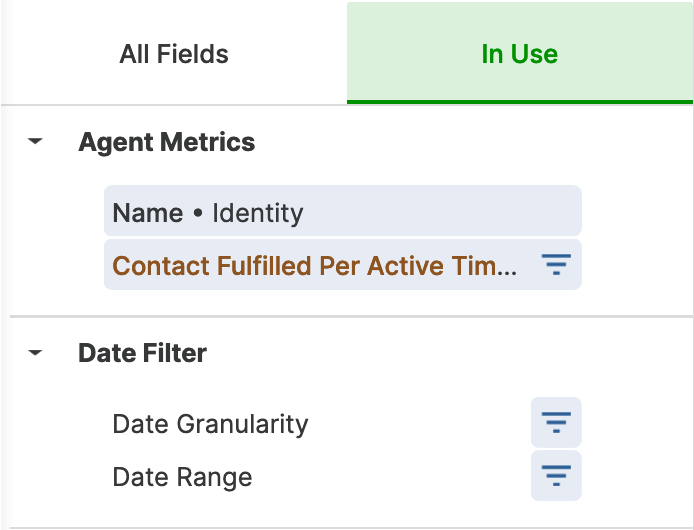
- Within All Fields, locate and add the following:
- Identity
- Name
- Contacts Fulfilled
- Contact Fulfilled Per Active Time Hour
- Identity
Filters, Visualizations, and Data:
- In the Filters tab, update the filter as follows:
- Date Filter Date Range is in the past 1 complete weeks.

- Date Filter Date Range is in the past 1 complete weeks.
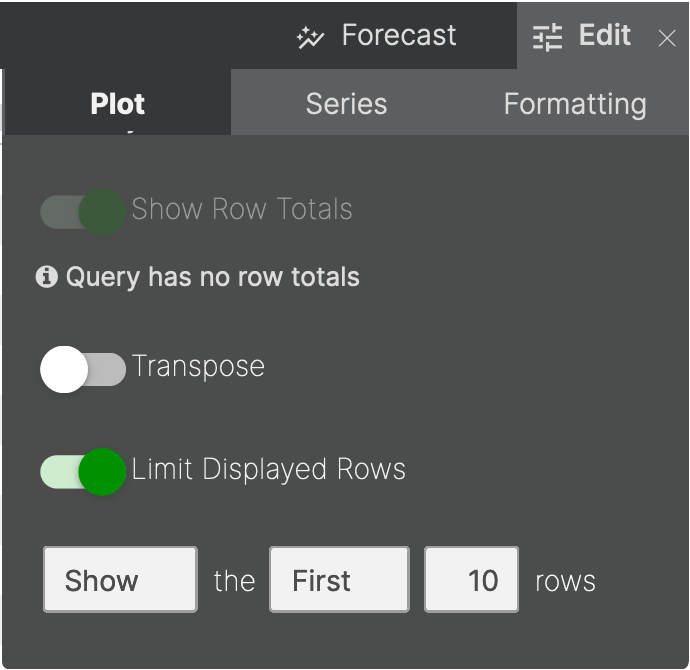
- Within Visualization, click Edit at the right side.
- Within Plot input the following:
- Limit Displayed Rows: Toggle on
- Show the First 10 rows

- Within Plot input the following:
- In the Data tab, complete the following actions:
- Click the sort icon next to Contact Fulfilled Per Active Time Hour.
- Choose Descending to get the top contributors (those with the highest fulfilled Contacts).
OR
Choose Ascending to get the bottom contributors (those with the lowest fulfilled Contacts).
- Choose Descending to get the top contributors (those with the highest fulfilled Contacts).
- Click the sort icon next to Contact Fulfilled Per Active Time Hour.
- Click Run.

About the Recipe
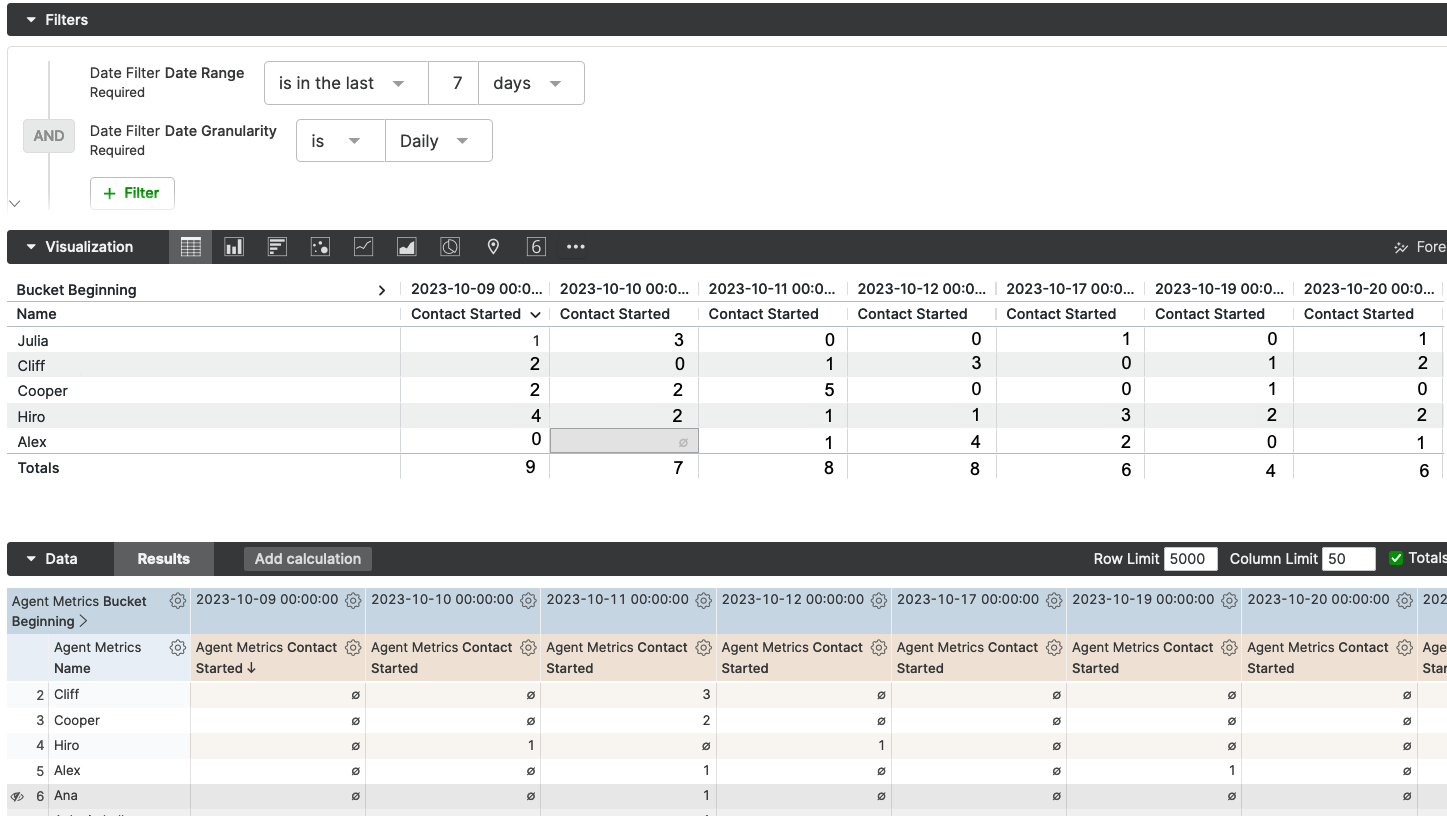
In this Insight Builder Report Recipe, you’ll learn how to report on the number of Contacts that have been initiated by Agents on a daily basis. This recipe will look at this data over the past 1 week.
Recipe Components
Dataset:
- Agent Metrics
Dimensions:
- Identity
- Name
- Time Bucket
- Bucket Beginning
Measures:
- Contact Started
- Contact Started
Method
Fields:
- From Reports, click the Create a Report dropdown.
- Select Agent Metrics.
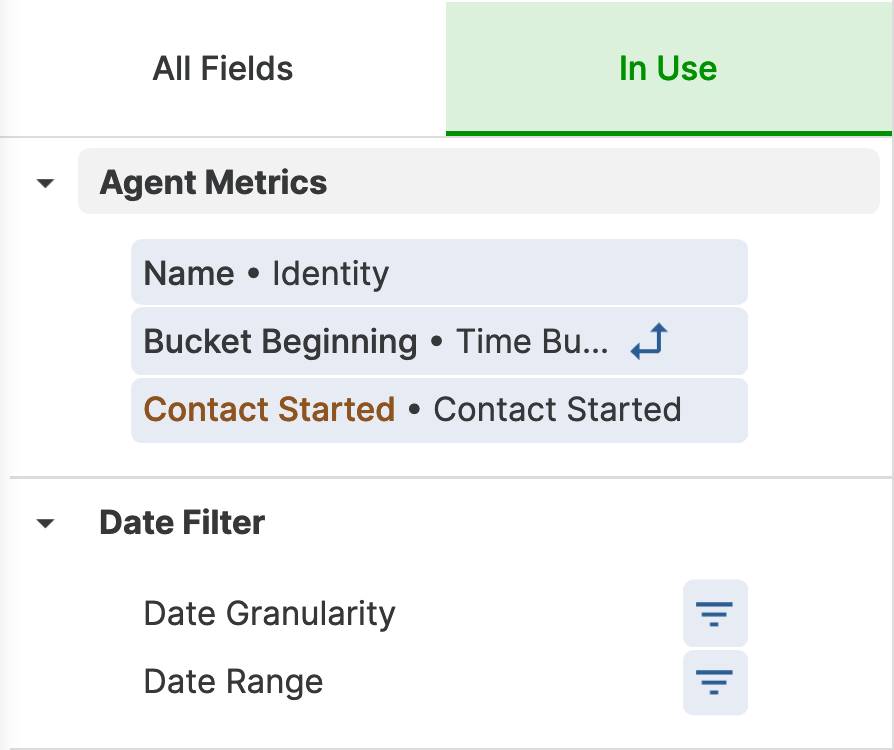
- Within All Fields, locate and add the following:
- Identity
- Name
- Time Bucket
- Bucket Beginning
- Contact Started
- Contact Started
- Identity
- Click the In Use tab.
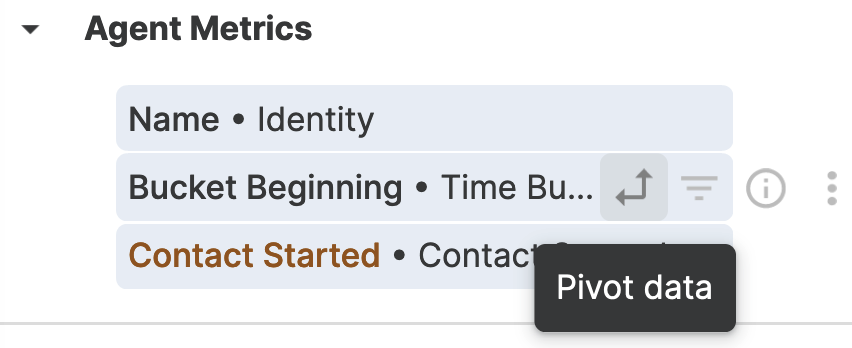
- Hover over the metric Bucket Beginning and click Pivot.

- Hover over the metric Bucket Beginning and click Pivot.
Filters, Visualizations, and Data:
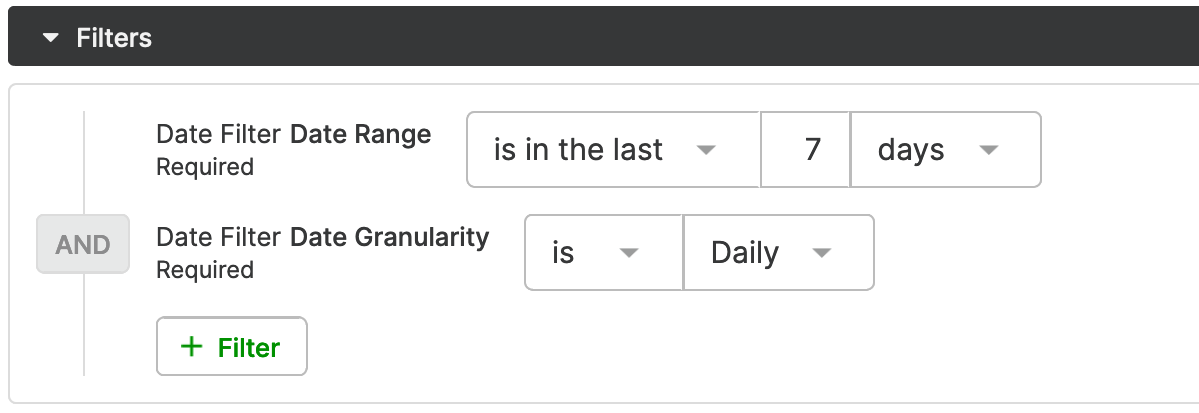
- In the Filters tab, update the filter as follows:
- Date Filter Date Range is in the past 7 days.
 .
.
- Date Filter Date Range is in the past 7 days.
- In the Data tab, click the following checkboxes in the header of the section:
- Totals

- Totals
- In the Visualization tab, complete the following actions:
- Set the Visualization to Table.

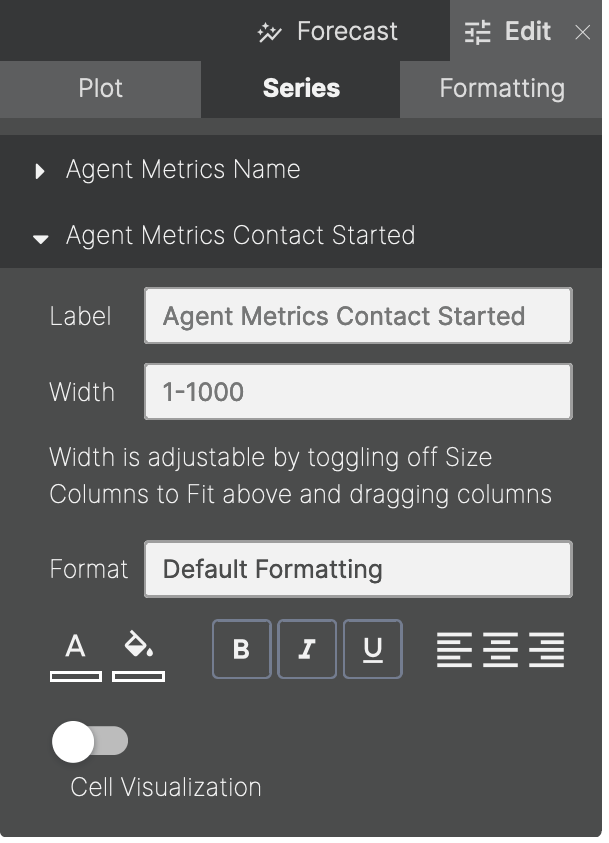
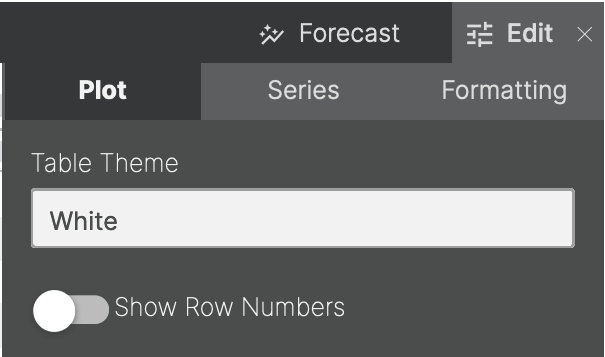
- At the right side of the Visualization tab, click Edit.
- Under Series, toggle off Cell Visualization for Contact Started.

- Under Plot, toggle off Show Numbers.

- Under Series, toggle off Cell Visualization for Contact Started.
- Set the Visualization to Table.
- Click Run.

About the Recipe
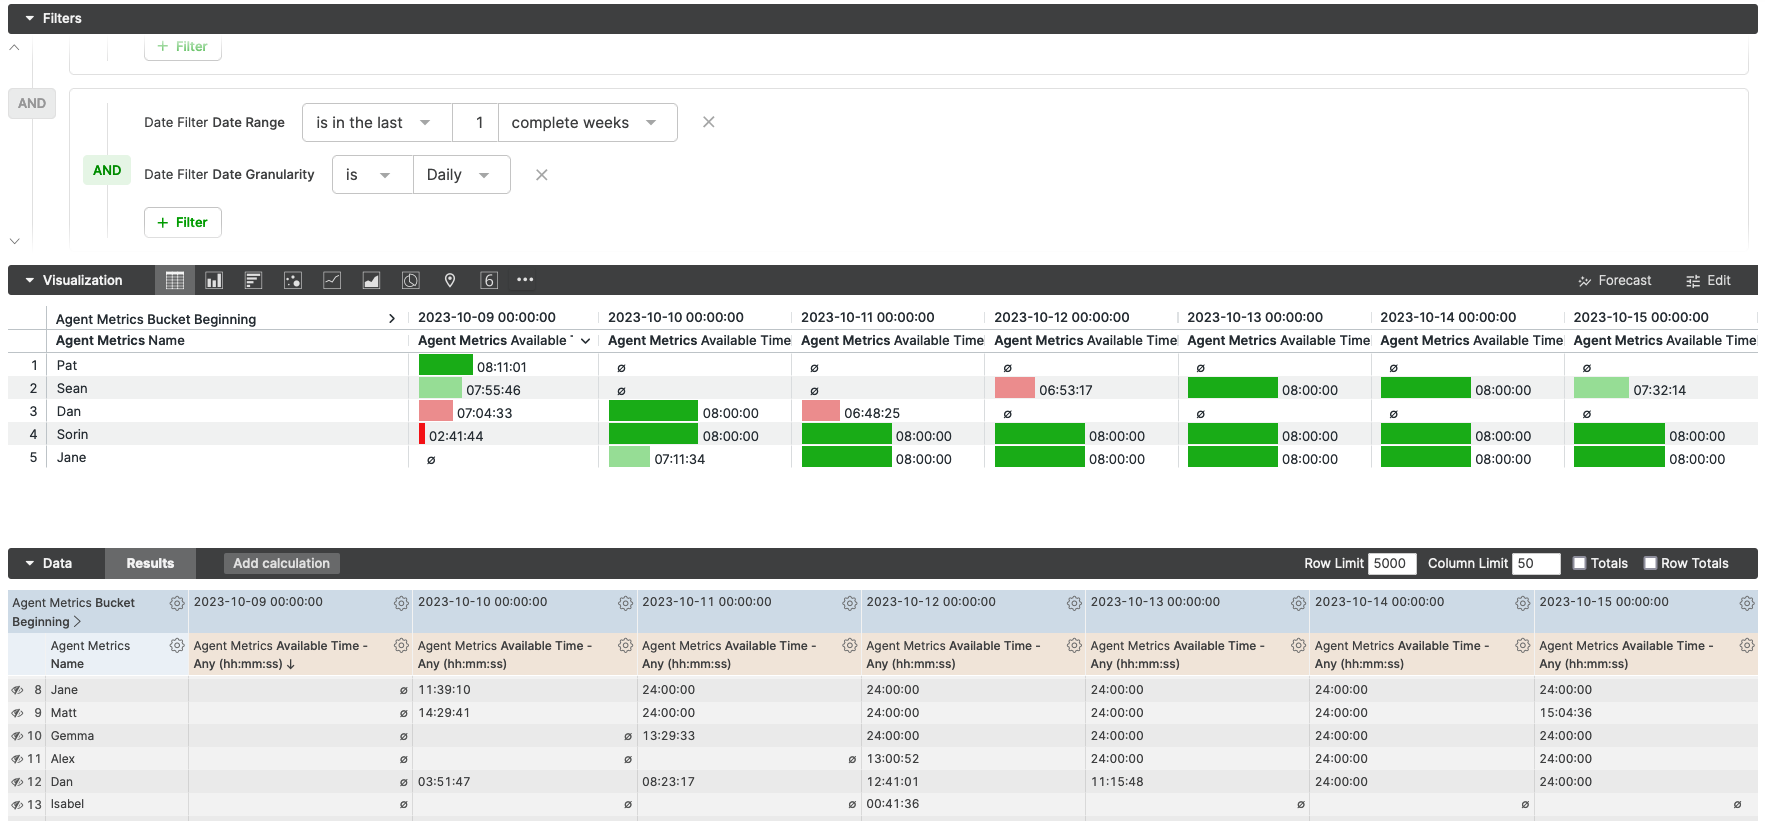
In this Insight Builder Report Recipe, you’ll learn how to report on whether your Agents are going available for the amount required of their shift. This recipe will look at the daily available time of each of your Agents.
Recipe Components
Dataset:
- Agent Metrics
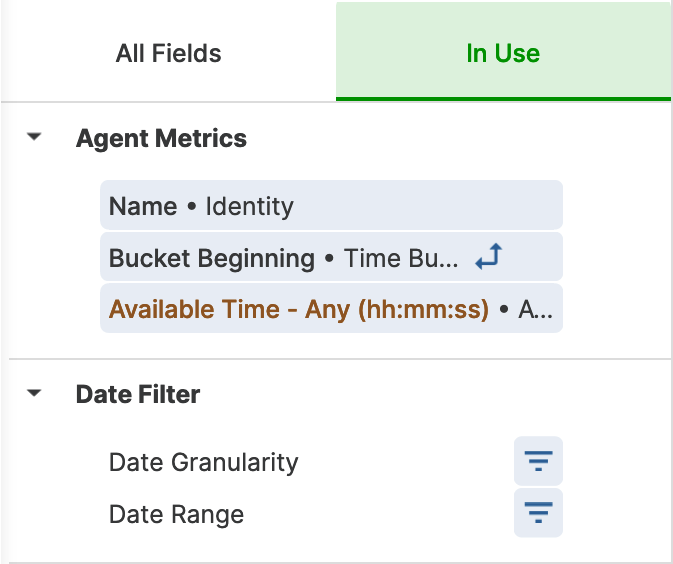
Dimensions:
- Identity
- Name
- Time Bucket
- Bucket Beginning
Measures:
- Available Time (hh:mm:ss)
- Available Time – Any (hh:mm:ss)

Method
Fields:
- From Reports, click the Create a Report dropdown.
- Select Agent Metrics.
- Within All Fields, locate and add the following:
- Identity
- Name
- Time Bucket
- Bucket Beginning
- Available Time (hh:mm:ss)
- Available Time – Any (hh:mm:ss)
- Identity
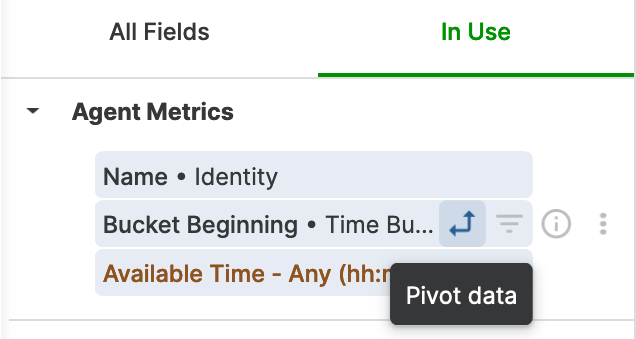
- Click the In Use tab.
- Hover over the metric Bucket Beginning and click Pivot.

- Hover over the metric Bucket Beginning and click Pivot.
Filters, Visualizations, and Data:
- In the Filters tab, update the filter as follows:
- Date Filter Date Range is in the past 1 complete weeks.


- Date Filter Date Range is in the past 1 complete weeks.
- In the Visualization tab, complete the following actions:
- Set the Visualization to Table.


- Set the Visualization to Table.
- Click Run.

About the Recipe
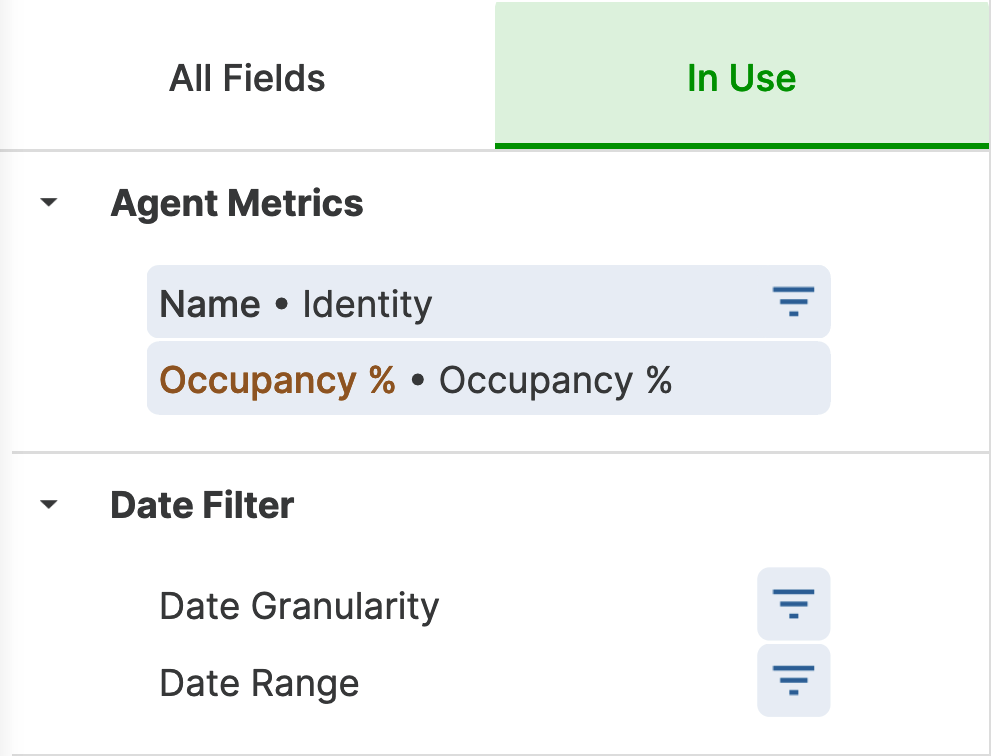
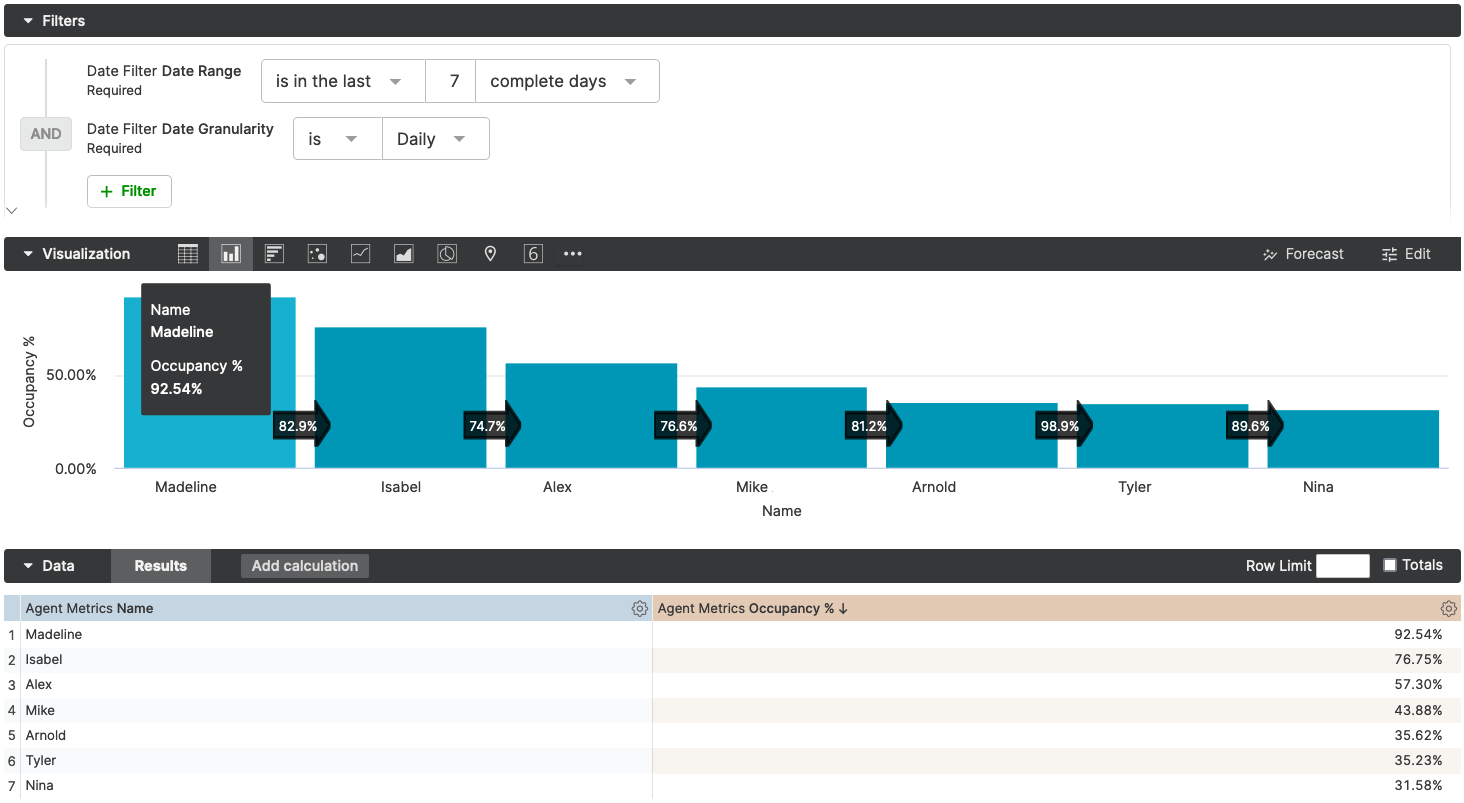
In this Insight Builder Report Recipe, you’ll learn how to report on the average Occupancy of particular Agents. This recipe will look at the Occupancy % by Agent over the last 7 days.
Recipe Components
Dataset:
- Agent Metrics
Dimensions:
- Identity
- Name
Measures:
- Occupancy %
- Occupancy %

Method
Fields:
- From Reports, click the Create a Report dropdown.
- Select Agent Metrics.
- Within All Fields, locate and add the following:
- Identity
- Name
- Occupancy %
- Occupancy %
- Identity
Filters, Visualizations, and Data:
- In the Filters tab, update the filter as follows:
- Date Filter Date Range is in the past 1 complete weeks.


- Date Filter Date Range is in the past 1 complete weeks.
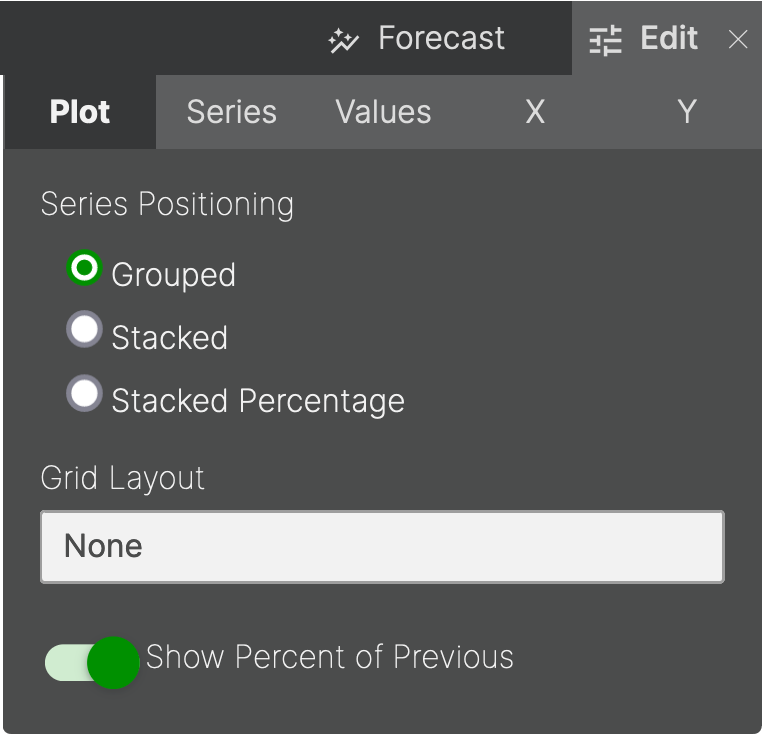
- Within Visualization, click Edit at the right side.
- Within Plot toggle on Show Percent of Previous:

- Within Plot toggle on Show Percent of Previous:
- Click Run.

Contact Performance #
Analyze how effectively your team is handling Contacts.
About the Recipe
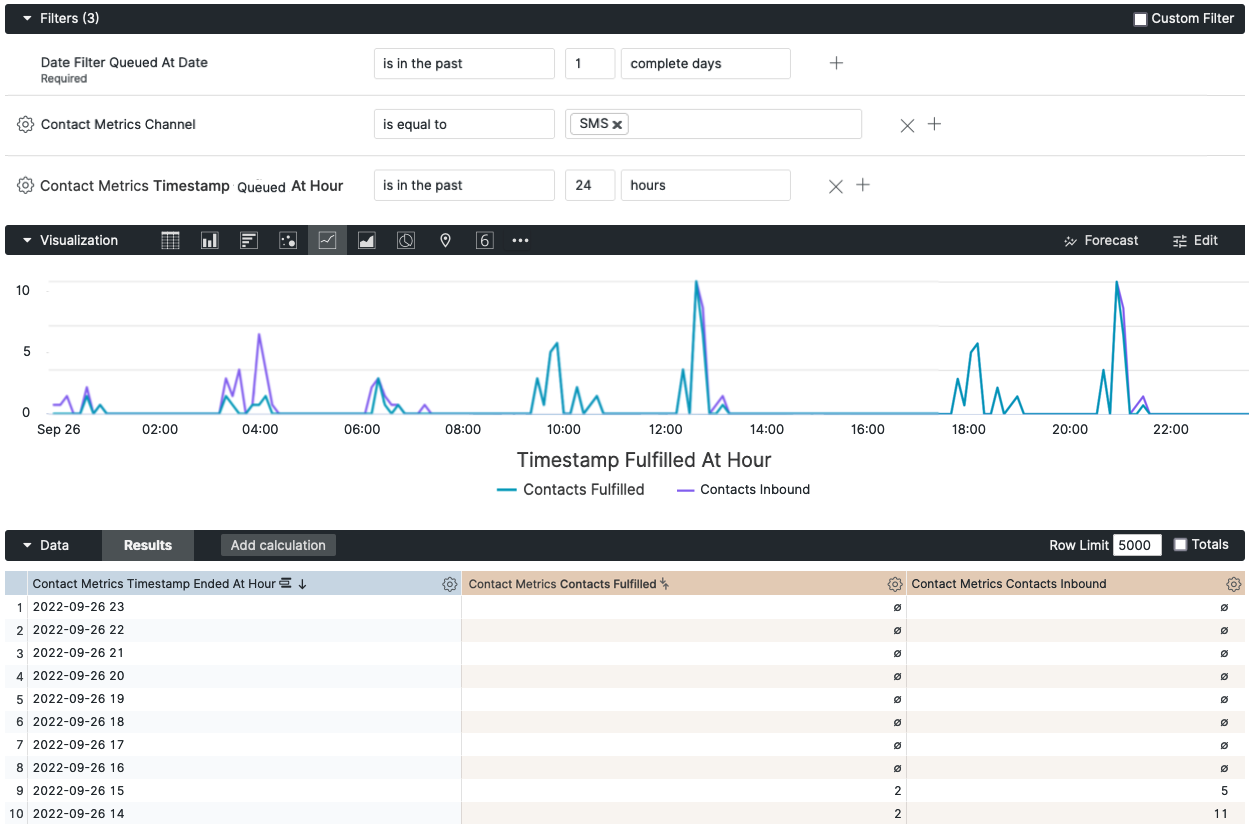
In this Insight Builder Report Recipe, you’ll learn how to report on inbound SMS Contacts and which of those are fulfilled. This recipe will look at the number of Contacts Fulfilled on an hourly basis.
Recipe Components
Dataset:
- Contact Metrics
Dimensions:
- Timestamp Queued At Hour
Measures:
- Contacts Fulfilled
- Contacts Inbound
Method
Fields:
- From Reports, click the Create a Report dropdown.
- Select Contact Metrics.
- Within All Fields, locate and add the following:
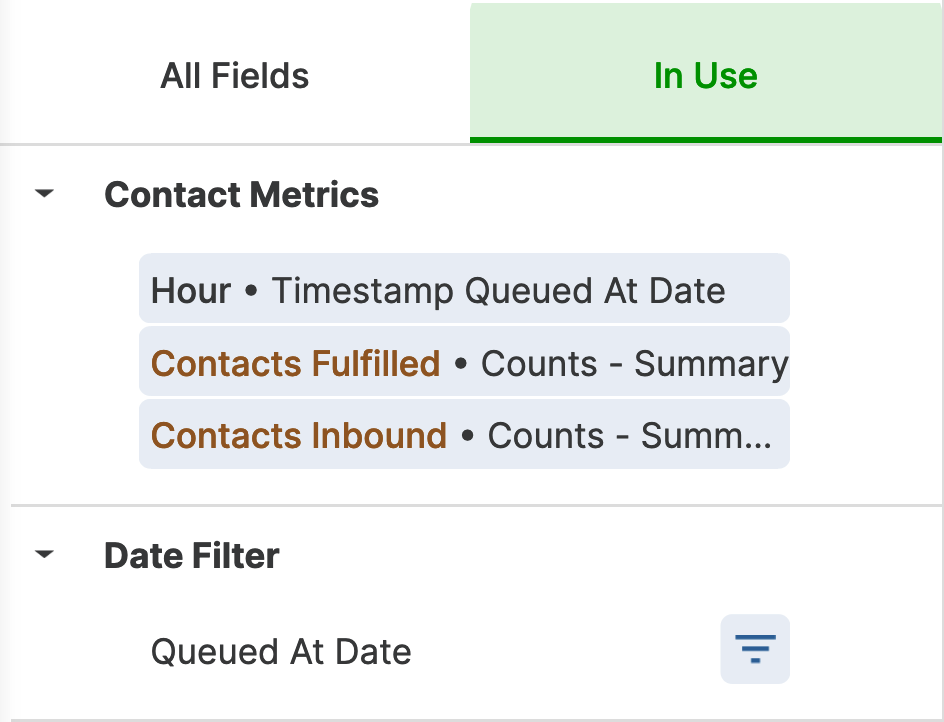
- Timestamp Queued At Date
- Hour
- Contacts Fulfilled
- Contacts Inbound
- Timestamp Queued At Date

Filters, Visualizations, and Data:
- In the Filters tab, update the filter as follows:
- Date Filter Queued At Date is in the past 1 complete days
- Contact Metrics is equal to SMS
- Contact Metrics Timestamp Fulfilled At Hour is in the past 24 hours


- In the Visualization tab, select the Line visual.


- Click Run.

Advanced Tip
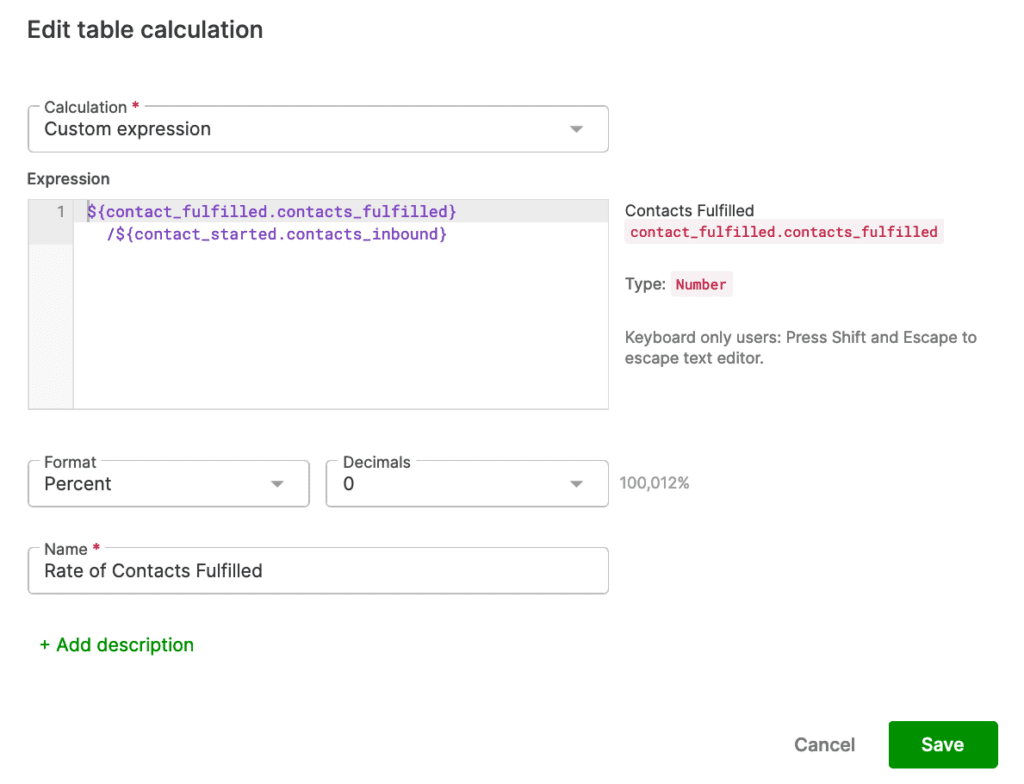
Use a calculation to look at the rate of Contacts Fulfilled. Follow the below steps:
- Click Add Calculation.
- Input the following expression: ${contact_fulfilled.contacts_fulfilled}/${contact_started.contacts_inbound}
- Set the Format to Percent.
- Name your Calculation.
- Click Save.


About the Recipe
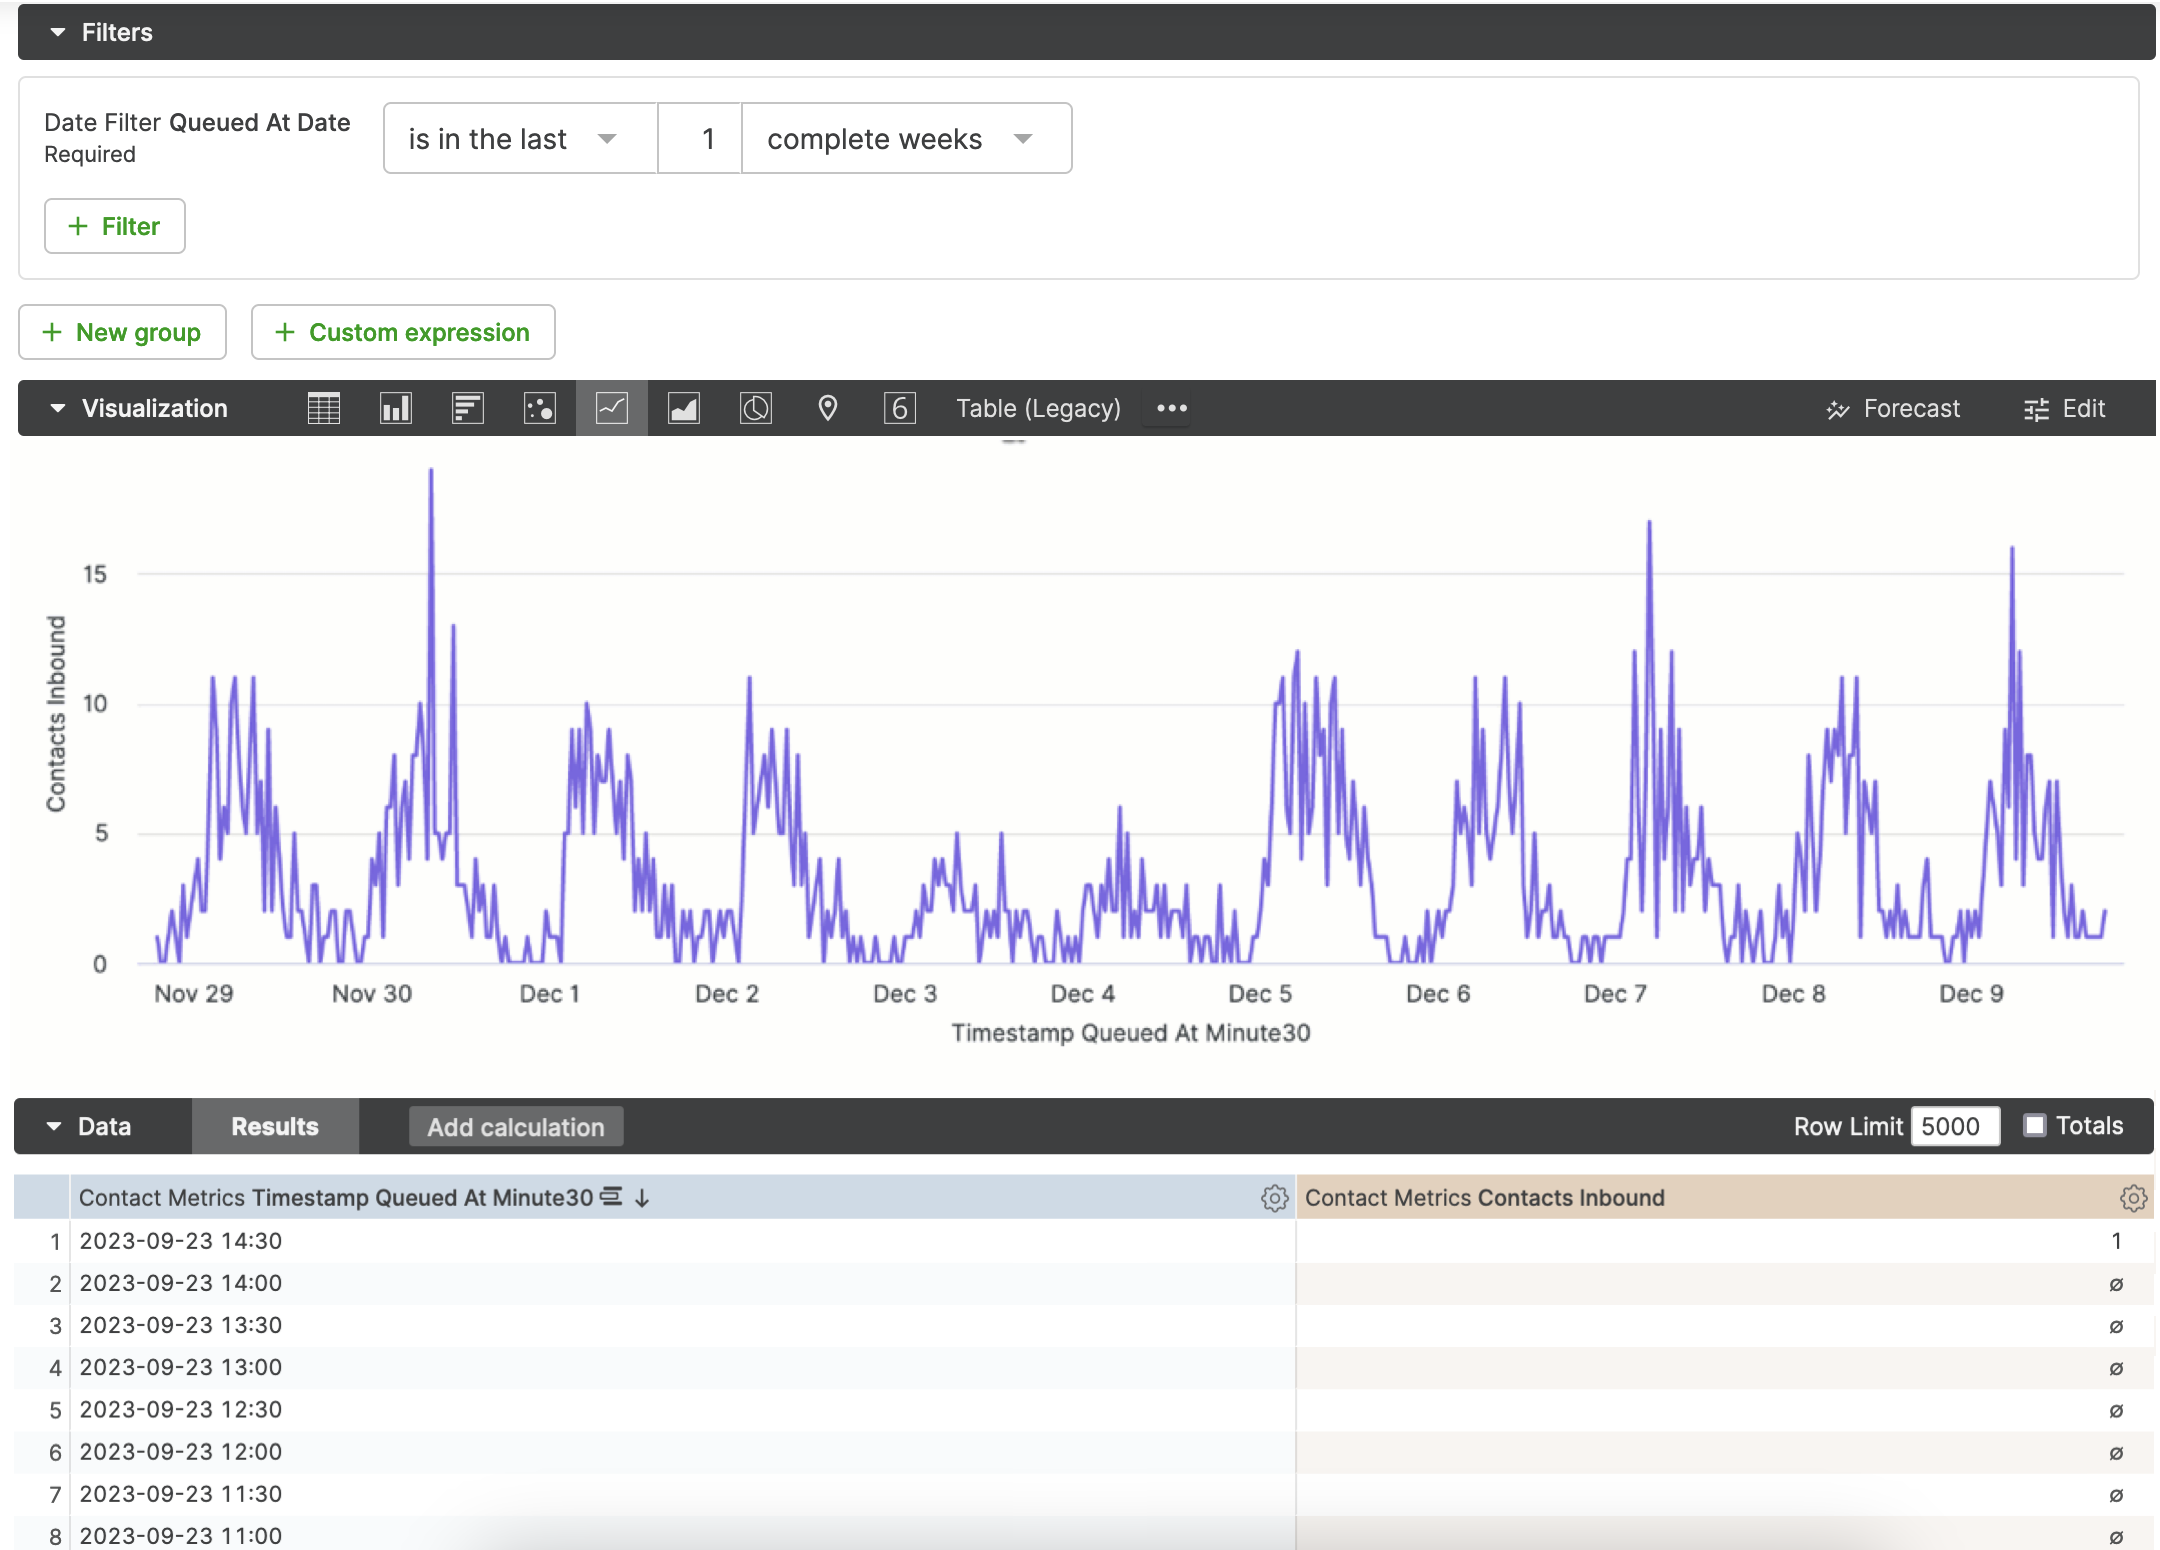
In this Insight Builder Report Recipe, you’ll learn how to report on the inbound Contacts every half-hour. This recipe will look at the number of inbound Contacts at every 30-minute interval.
Recipe Components
Dataset:
- Contact Metrics
Dimensions:
- Timestamp Queued at Date
- Minute30
Measures:
- Contacts Inbound

Method
Fields:
- From Reports, click the Create a Report dropdown.
- Select Contact Metrics.
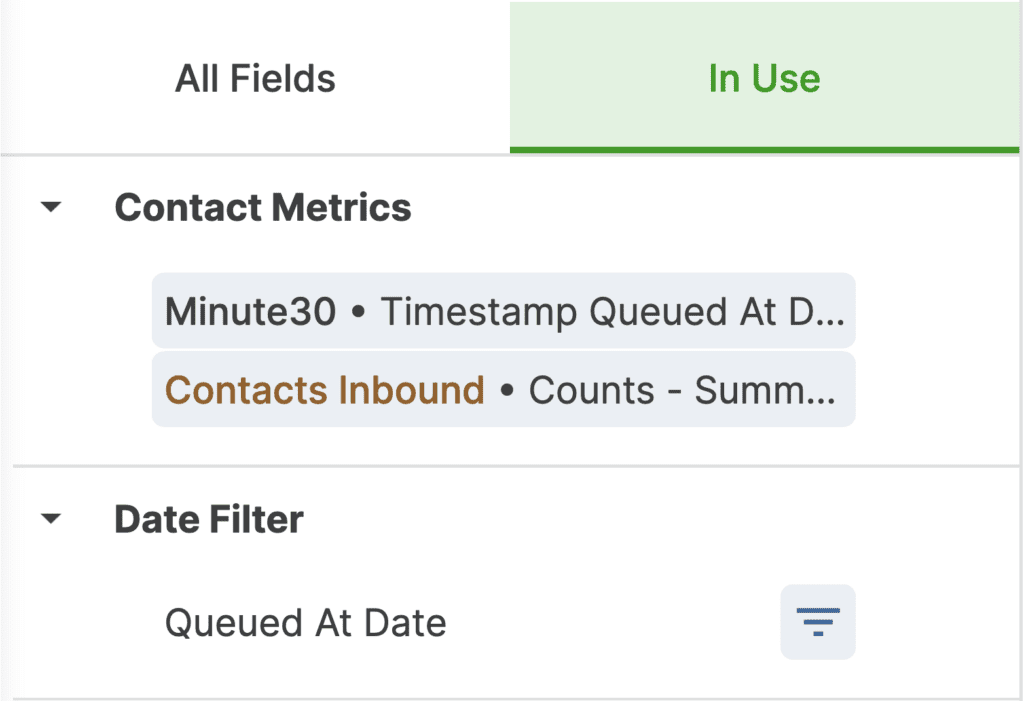
- Within All Fields, locate and add the following:
- Contacts Inbound
- Timestamp Queued at Date
- Minute30
Filters, Visualizations, and Data:
- In the Filters tab, update the filter as follows:
- Date Filter Date Range is in the past 1 complete weeks


- Date Filter Date Range is in the past 1 complete weeks
- In the Visualization tab, select the Line visual.


- Click Run.

Conversation Performance #
Analyze how effectively your team is handling Conversations.
About the Recipe
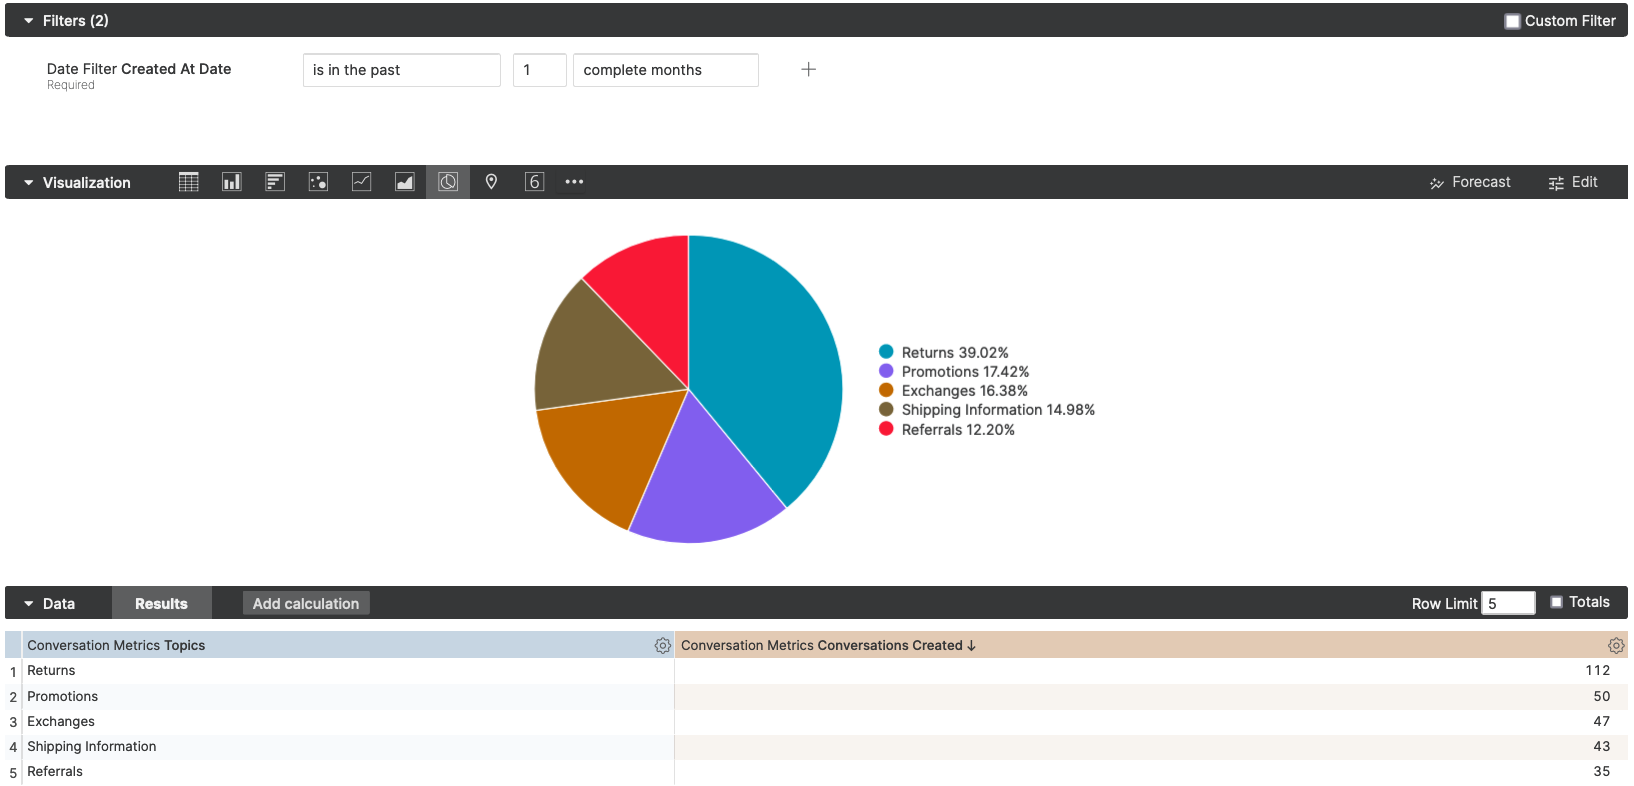
In this Insight Builder Report Recipe, you’ll learn how to report on Topics that are consistently being applied to your Conversations. This recipe will look at the top 5 Topics being applied over the past month.
Recipe Components
Dataset:
- Conversation Metrics
Dimensions:
- Topics
Measures:
- Conversations Created
Method
Fields:
- From Reports, click the Create a Report dropdown.
- Select Conversation Metrics.
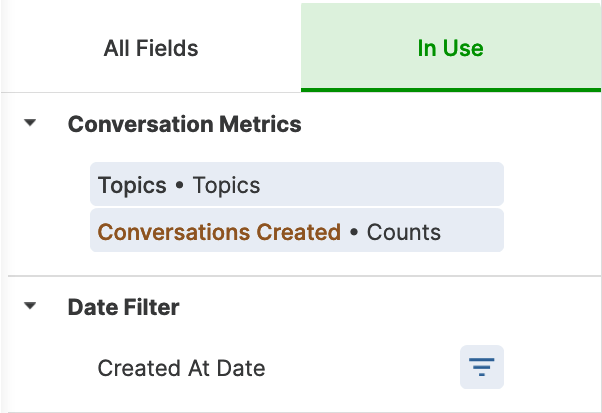
- Within All Fields, locate and add the following:
- Topics
- Topics
- Conversations Created
- Topics

Filters, Visualizations, and Data:
- In the Filters tab, update the filter as follows:
- Date Filter Created at Date is in the past 1 complete months


- Date Filter Created at Date is in the past 1 complete months
- In the Visualization tab, select the Pie visual.


- In the Data tab, set the Row Limit to 5.


- Click Run.

About the Recipe
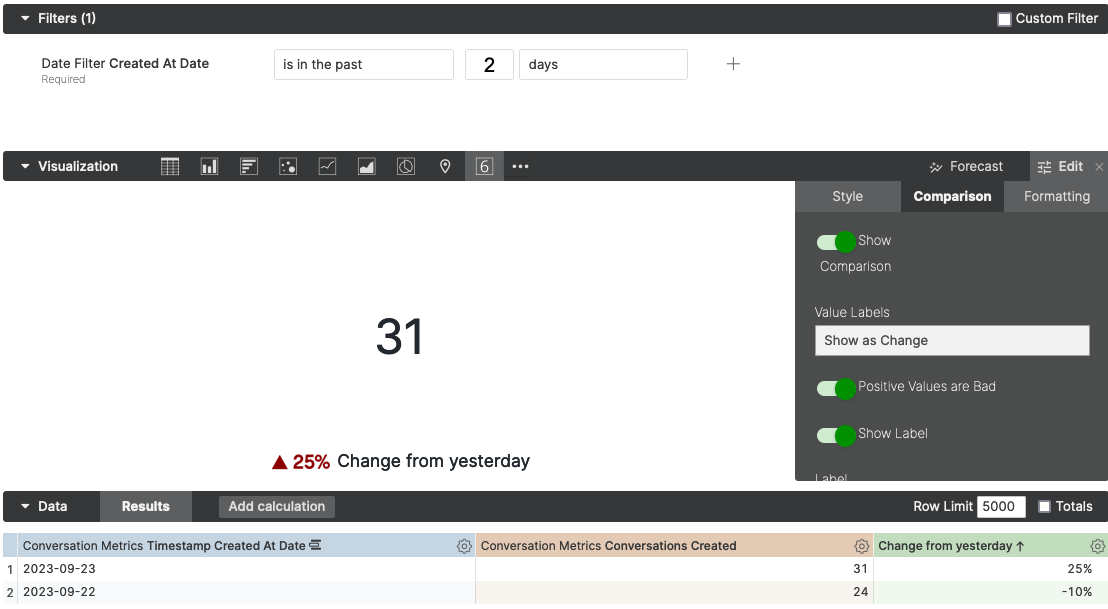
In this Insight Builder Report Recipe, you’ll learn how to report on the current day’s volume of Conversations and compare that to the previous day’s volume. This recipe will look at the number of Conversations created compared to the previous day.
Recipe Components
Dataset:
- Conversation Metrics
Dimensions:
- Timestamp Created At Date
Measures:
- Conversations Created
- Custom Calculation

Method
Fields:
- From Reports, click the Create a Report dropdown.
- Select Conversation Metrics.
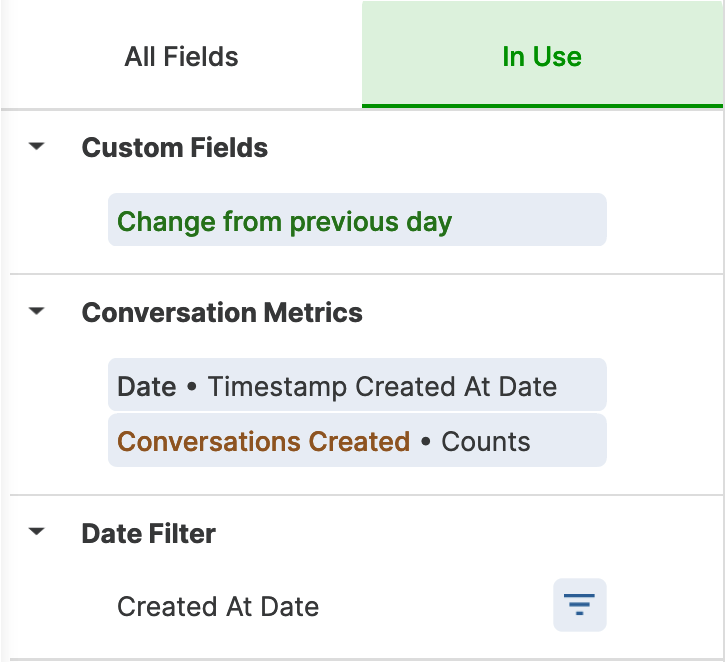
- Within All Fields, locate and add the following:
- Timestamp Created At Date
- Date
- Conversations Created
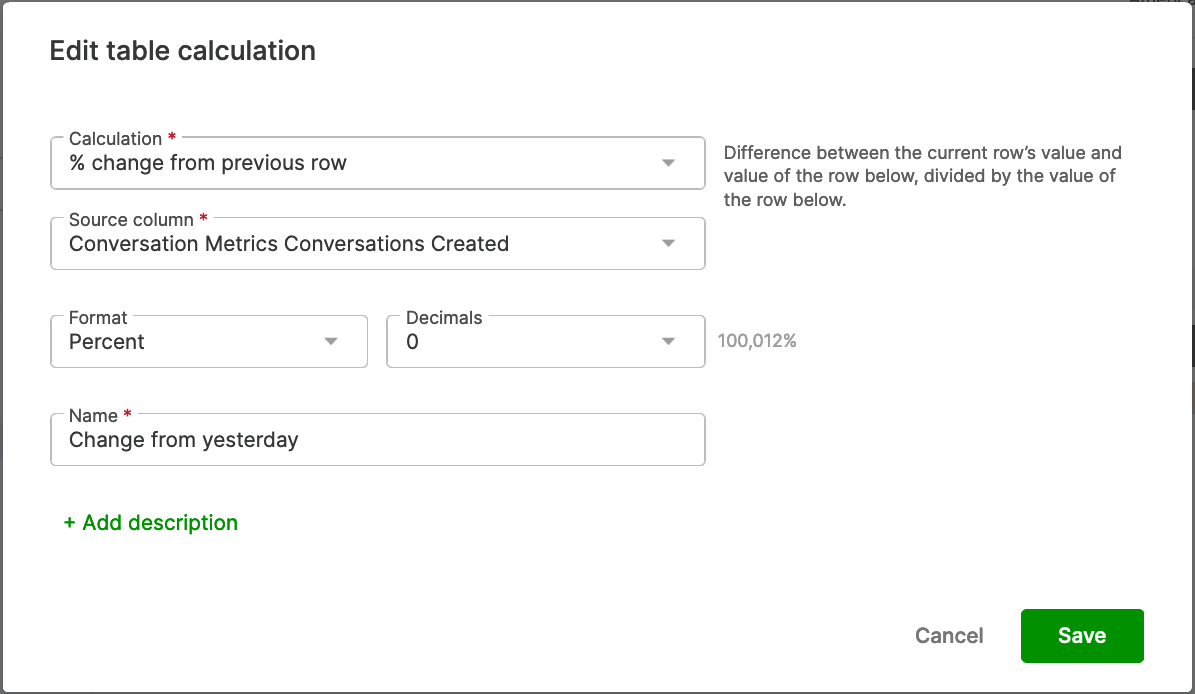
- Click Add Calculation. Set the following:
- Calculation: Change from previous row
- Source column: Conversation Metrics Conversations Created
- Format: Percent
- Name: optional

- Timestamp Created At Date
Filters, Visualizations, and Data:
- In the Filters tab, update the filter as follows:
- Timestamp Created At Date is in the past 2 days


- Timestamp Created At Date is in the past 2 days
- In the Visualization tab, select the Single Value visual.


- Then to the right of the Visualization click Edit to make changes to the Visualizations settings. Set the following:
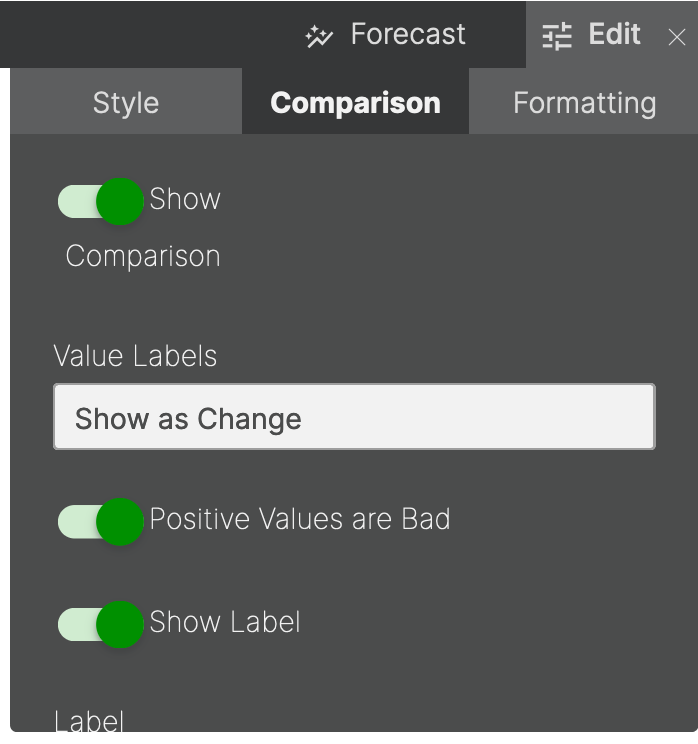
- Under the Comparison tab, set the following:
- Show Comparison: Toggle this on
- Value Labels: Show as Change
- Positive Values are Bad: Toggle this on

- Under the Comparison tab, set the following:
- Then to the right of the Visualization click Edit to make changes to the Visualizations settings. Set the following:
- Click Run.

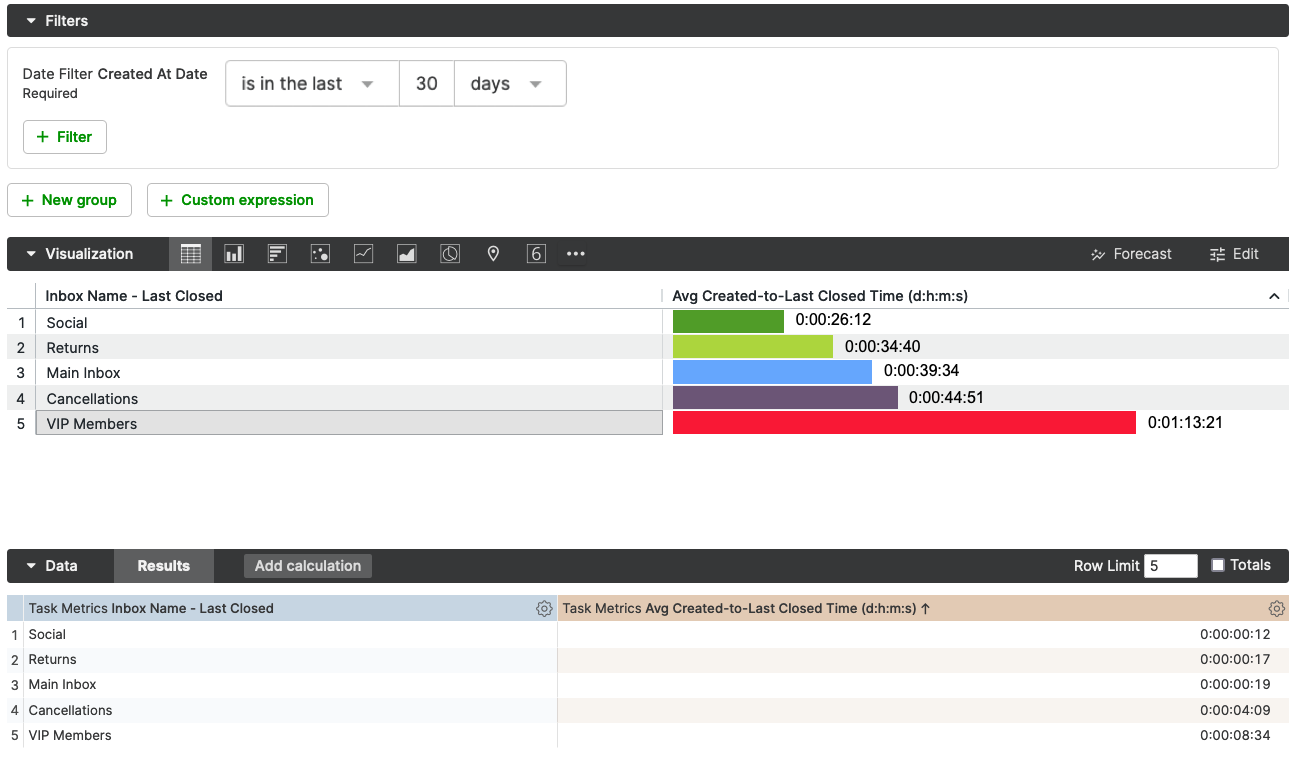
About the Recipe
In this Insight Builder Report Recipe, you’ll learn how to report on the Inboxes that have Tasks being closed the fastest. This recipe will look at the lowest average times from when a Task is created to when it is closed by within a particular Inbox.
Recipe Components
Dataset:
- Task Metrics
Dimensions:
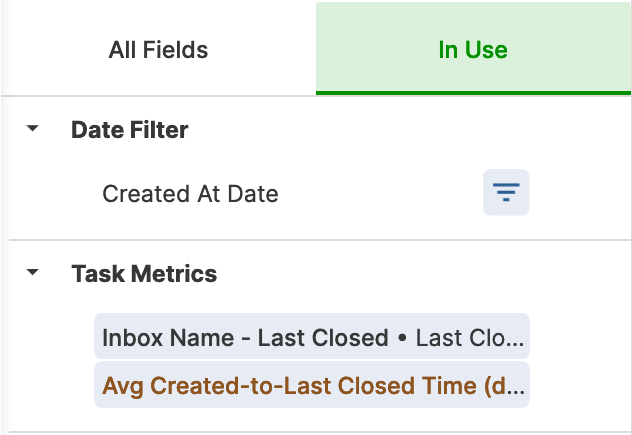
- Last Closed
- Inbox Name – Last Closed
Measures:
- Durations – Average (d:h:m:s)
- Avg Created-to-Last Closed Time (d:h:m:s)


Method
Fields:
- From Reports, click the Create a Report dropdown.
- Select Task Metrics.
- Within All Fields, locate and add the following:
- Last Closed
- Inbox Name – Last Closed
- Durations – Average (d:h:m:s)
- Avg Created-to-Last Closed Time (d:h:m:s)
- Last Closed


Filters, Visualizations, and Data:
- In the Filters tab, update the filter as follows:
- Timestamp Created At Date is in the past 30 days


- Timestamp Created At Date is in the past 30 days
- In the Visualization tab, select the Single Value visual.


- Click Run.







 .
.


