| REQUIRED USER ROLE Administrator, Team Manager, Analyst |
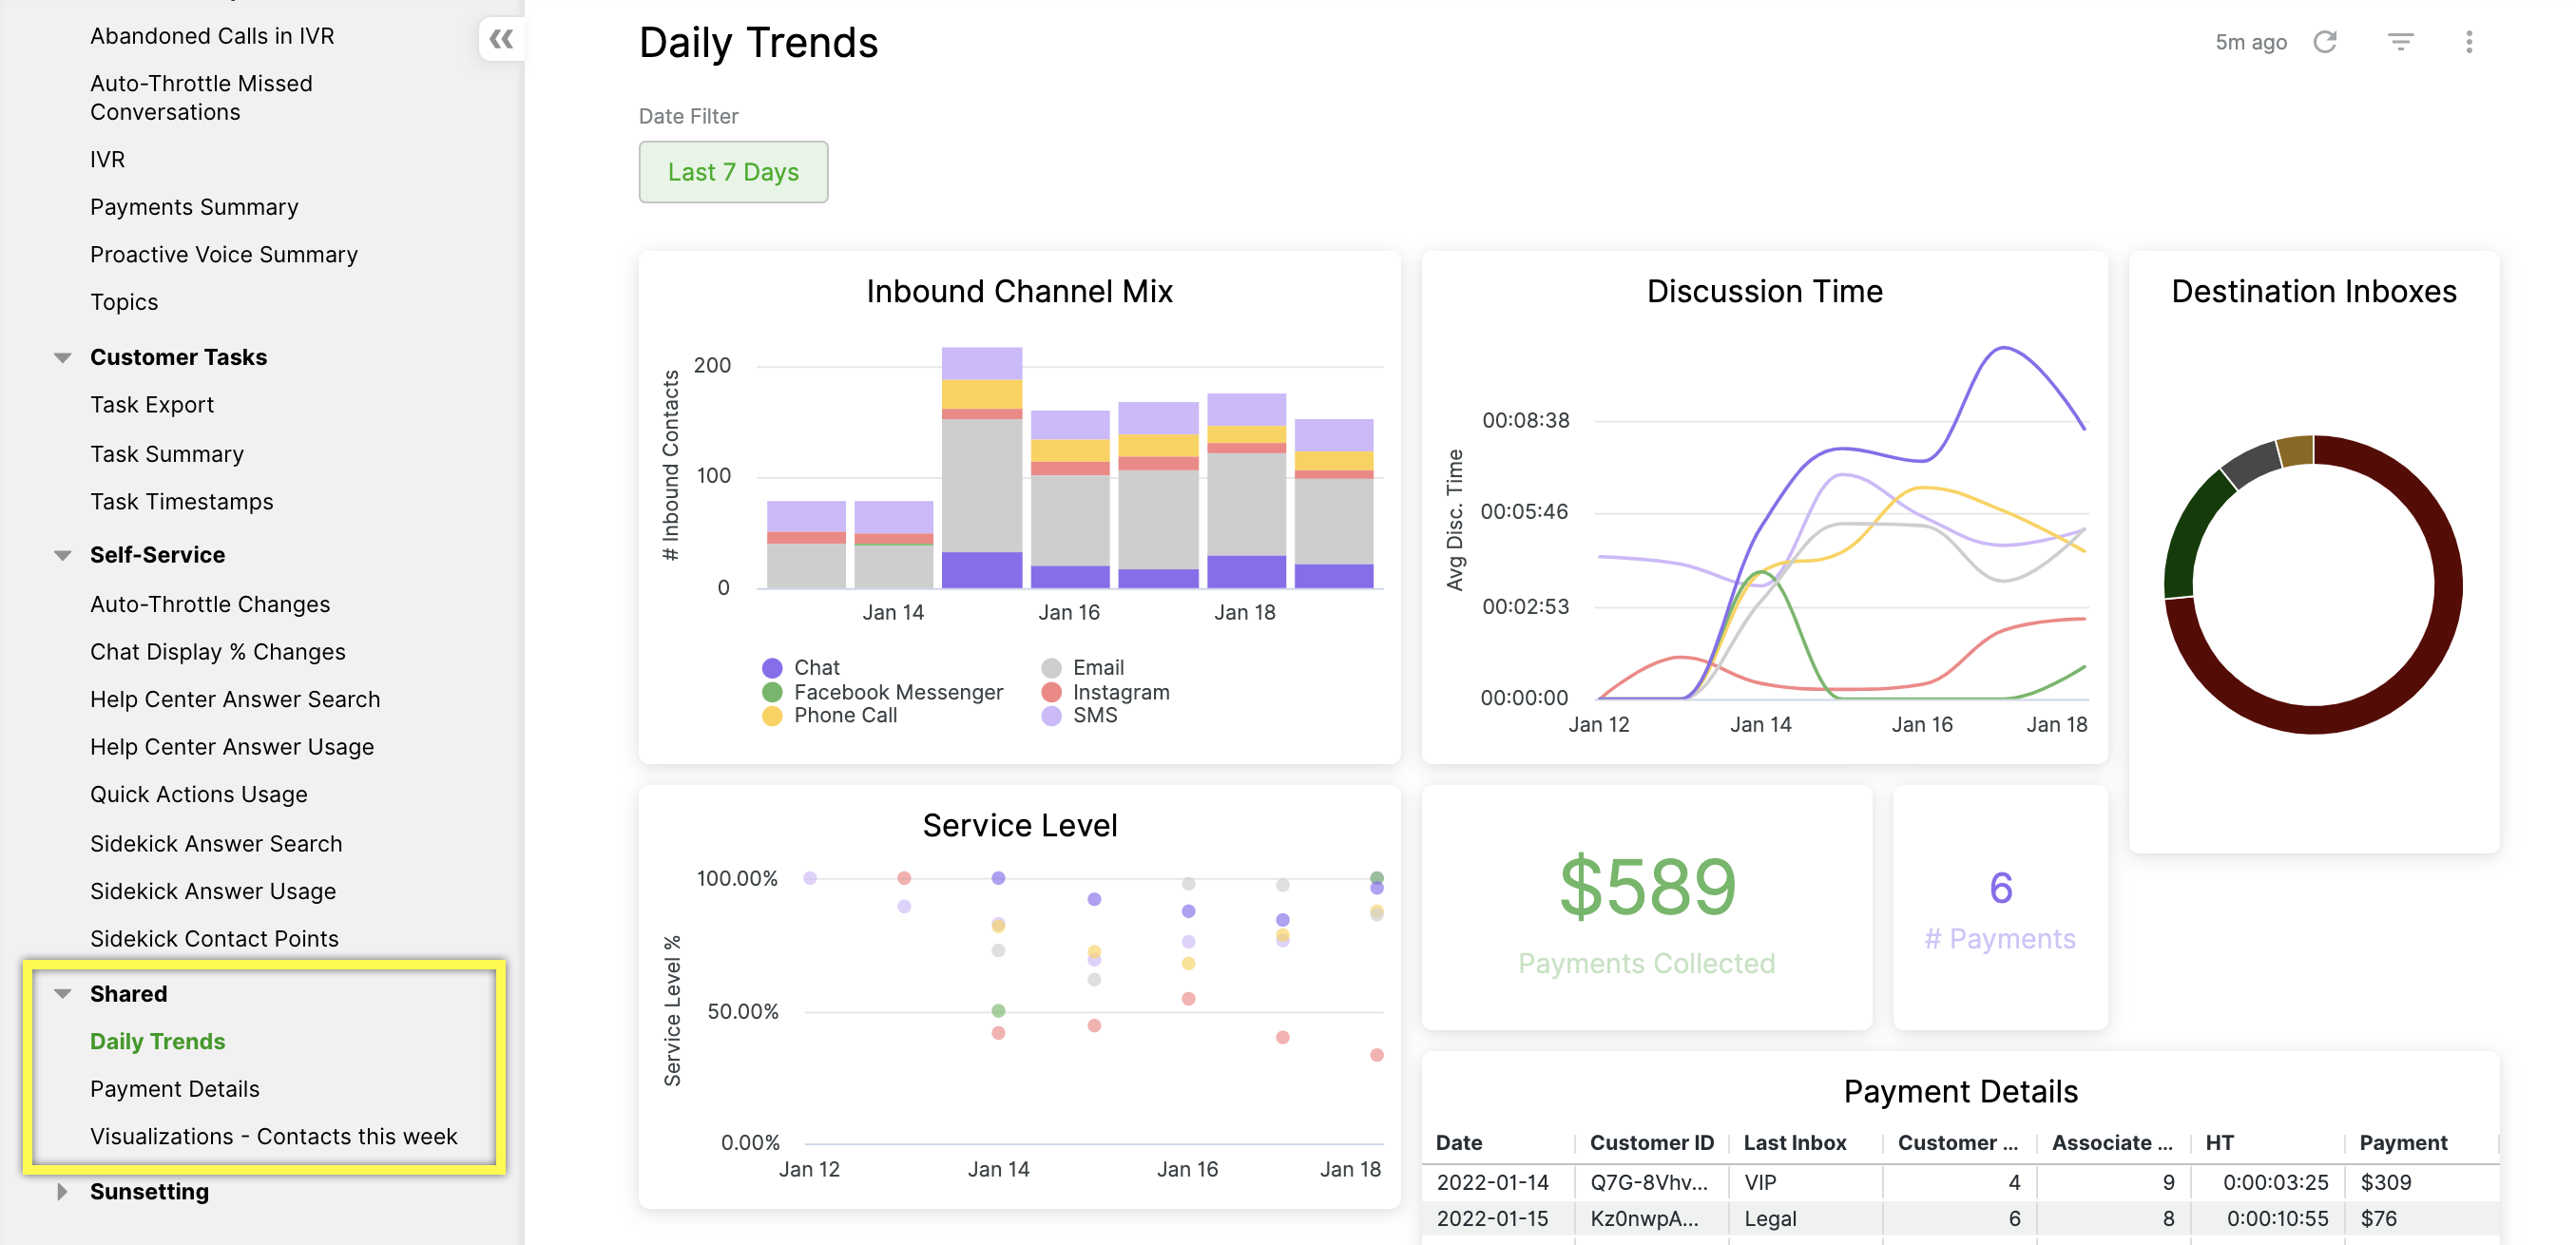
Reports are saved in a dashboard and found under the Shared category on the reports page.
While Analysts can create, edit, and save existing reports (i.e., update formulas, change visualizations, etc.) in a dashboard, non-analyst roles can only use filters configured by Analysts and made available in the dashboard.
View shared dashboards #
- Click the Menu icon on the top left corner of the screen.
- Click Reports.
- From the Reports page, on the report list on the left side of the screen, scroll down to the Shared category to find shared dashboards.

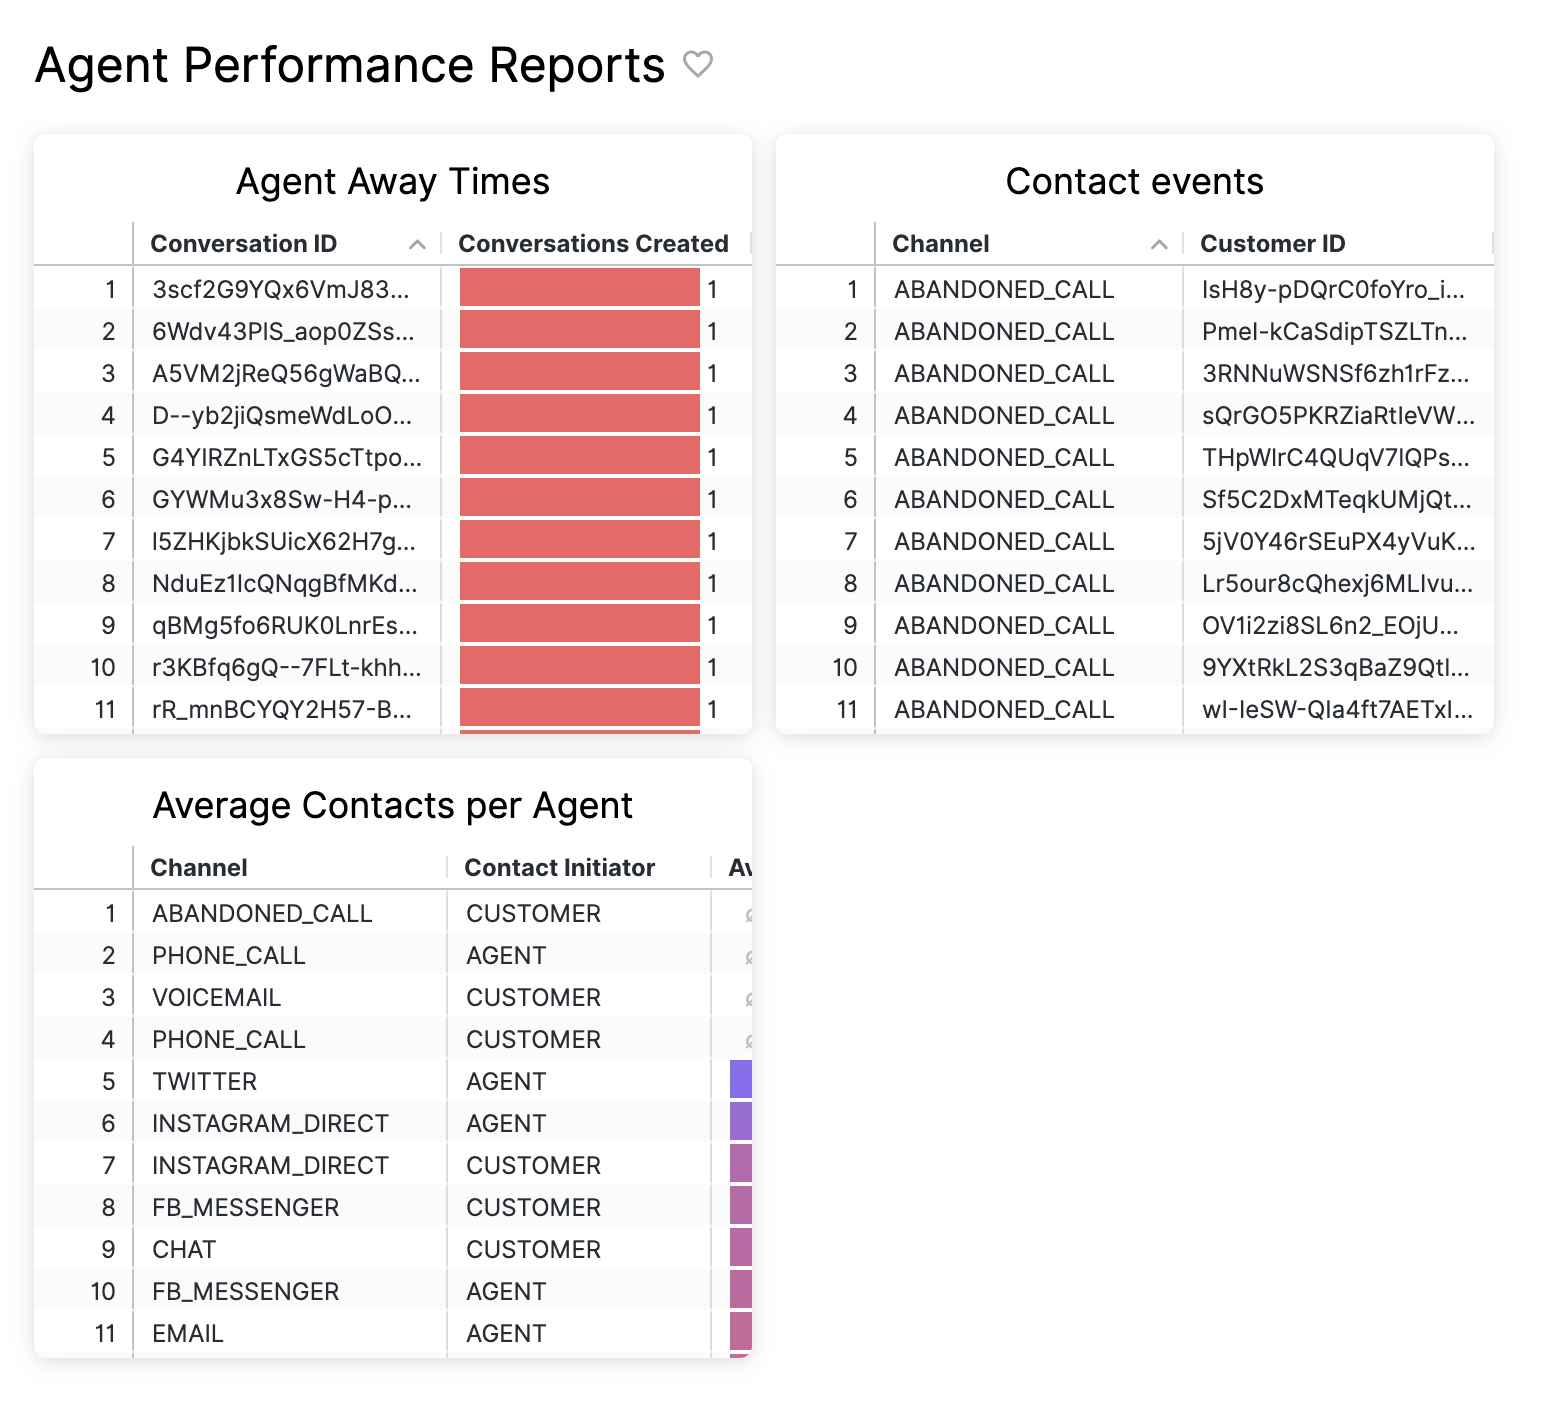
- Click a dashboard to open the dashboard view. This displays a tile view of reports linked to the dashboard.

Apply filters #
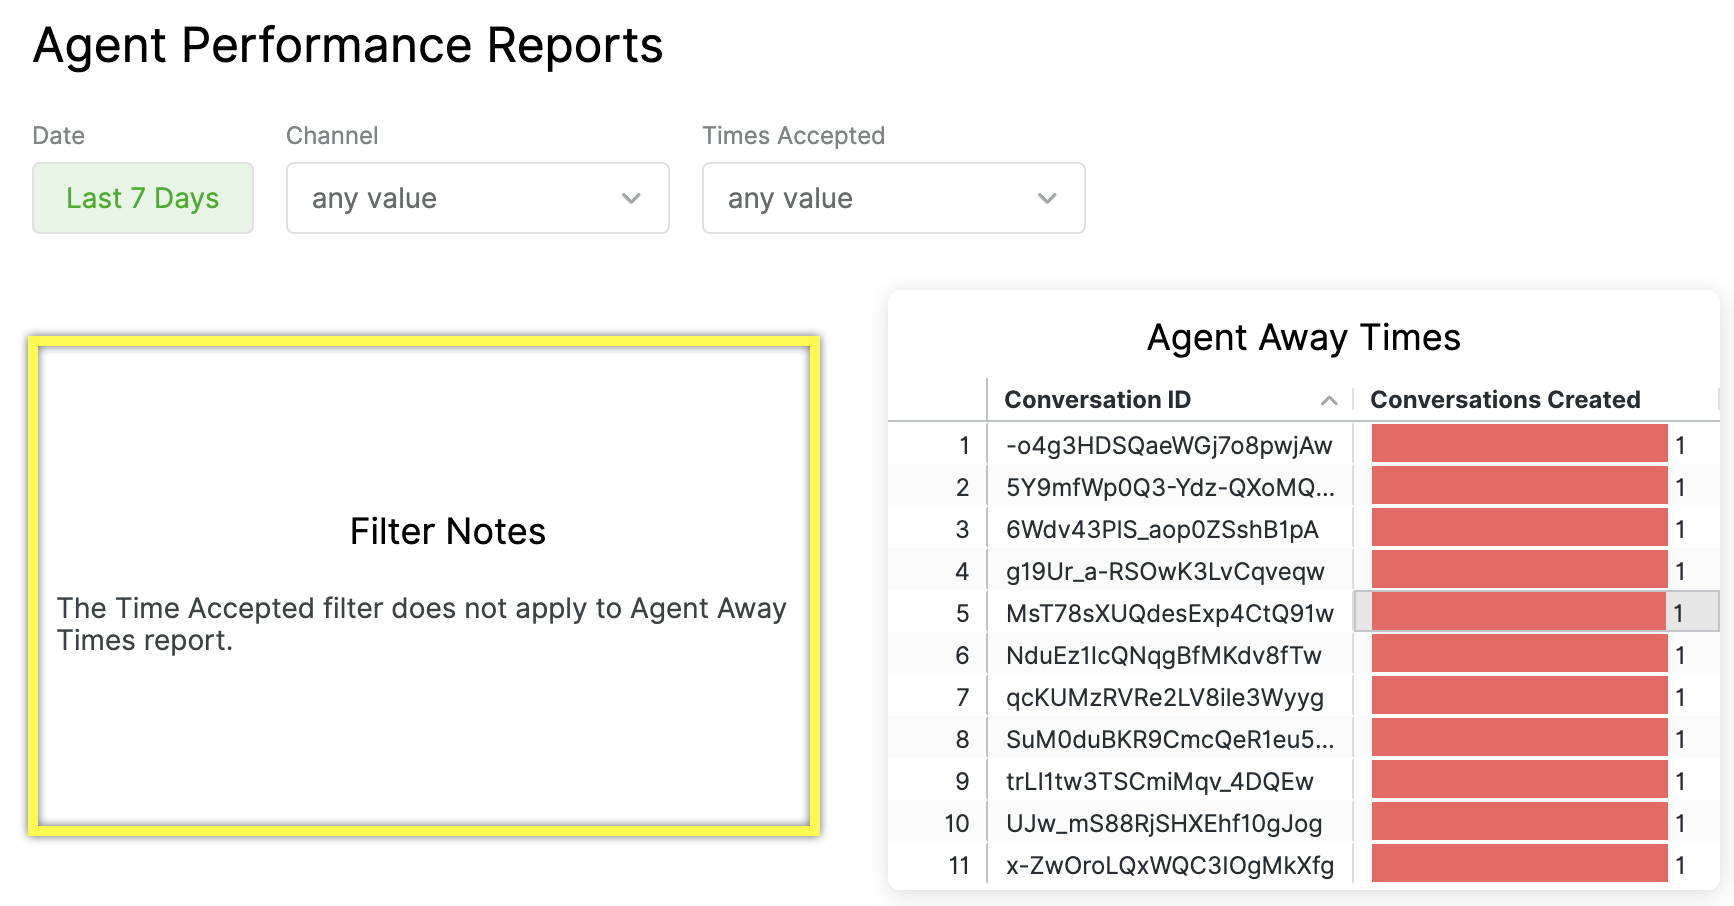
Reports are saved with a set filter that answers a particular question, but Analysts can also allow non-analysts to apply pre-configured filters. Pre-configured filters are found above the dashboard report tiles.

For example, an Analyst may share a report that allows non-analyst users to view the number of calls received in the last seven days. But through the filters feature, you may be able to change the date filter from the pre-configured date filter (e.g., 7 Days) and change it to 14 days if an Analyst configures the date filter.
- From the Reports page, on the report list on the left side of the screen, scroll down to the Shared category to find shared dashboards.
- Click a dashboard to open the dashboard view. This displays a tile view of reports linked to the dashboard.
- Filters available for the dashboard appear on top of the reports (tiles).
- Note – Look out for tiles that may contain additional notes from an Analyst about the dashboard.

- Note – Look out for tiles that may contain additional notes from an Analyst about the dashboard.
- Select how you’d like to filter the reports, then click Refresh. This refreshes data in applicable reports in the dashboard.

Date filters #
Date filter behaviors vary slightly in a dashboard and or when creating a report.
For example, when creating a report using the report Builder, when using Date Range, the second date is “until before.” So if you’re looking to filter for data in February 2023, you’d use the range 2/1/2023 – 3/1/2023. On a dashboard, however, you use the actual end date. So in this example, it would be 2/1/2023 – 2/28/2023.
Change report timezone #
View dashboard reports at a different timezone.
- Click the menu icon on the top left corner of the screen.
- Click Reports.
- From the Reports page, on the report list on the left side of the screen, scroll down to the Shared category to find shared dashboards.
- Click a dashboard to open the dashboard view. This will display a tile view of reports associated with the dashboard.
- Click the kebab icon (three dots) on the top right corner of the dashboard, then click the current timezone.
- From the list, click the timezone to view the report and click Update.


