Sidekick Dashboard
Sidekick drives faster resolutions and more empowered Agents, and with the right insights, you can easily measure these results.

A single Dashboard to understand Sidekick performance
The Sidekick Dashboard has been crafted by data experts to provide a cohesive place to view and assess the metrics that are integral to managing Sidekick.
Examples of how you can use the Sidekick Dashboard to improve your AI-assisted Customer experiences:

1. Balance your impact by Channel
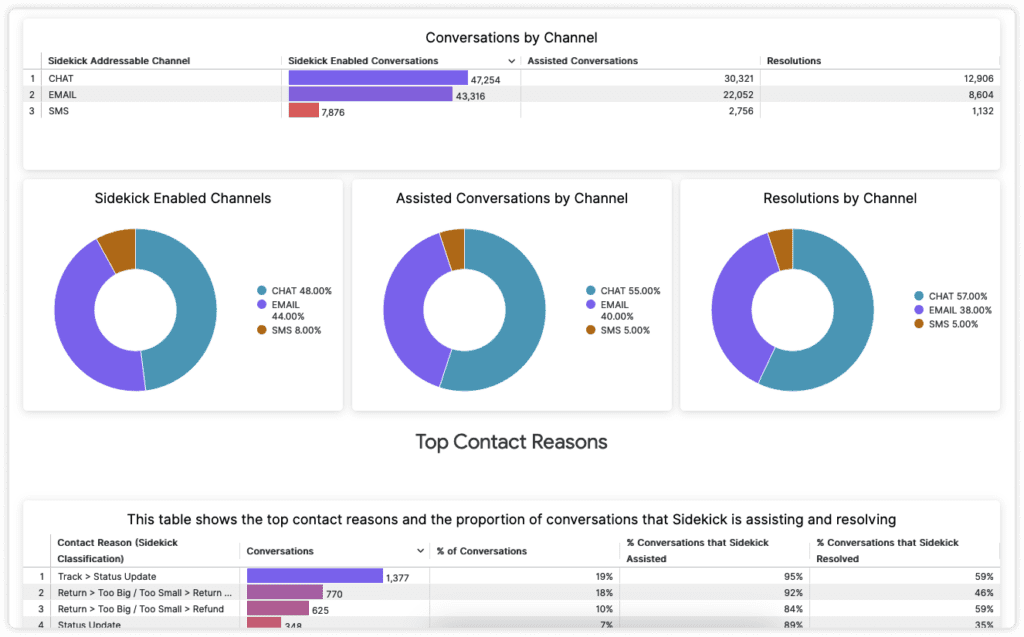
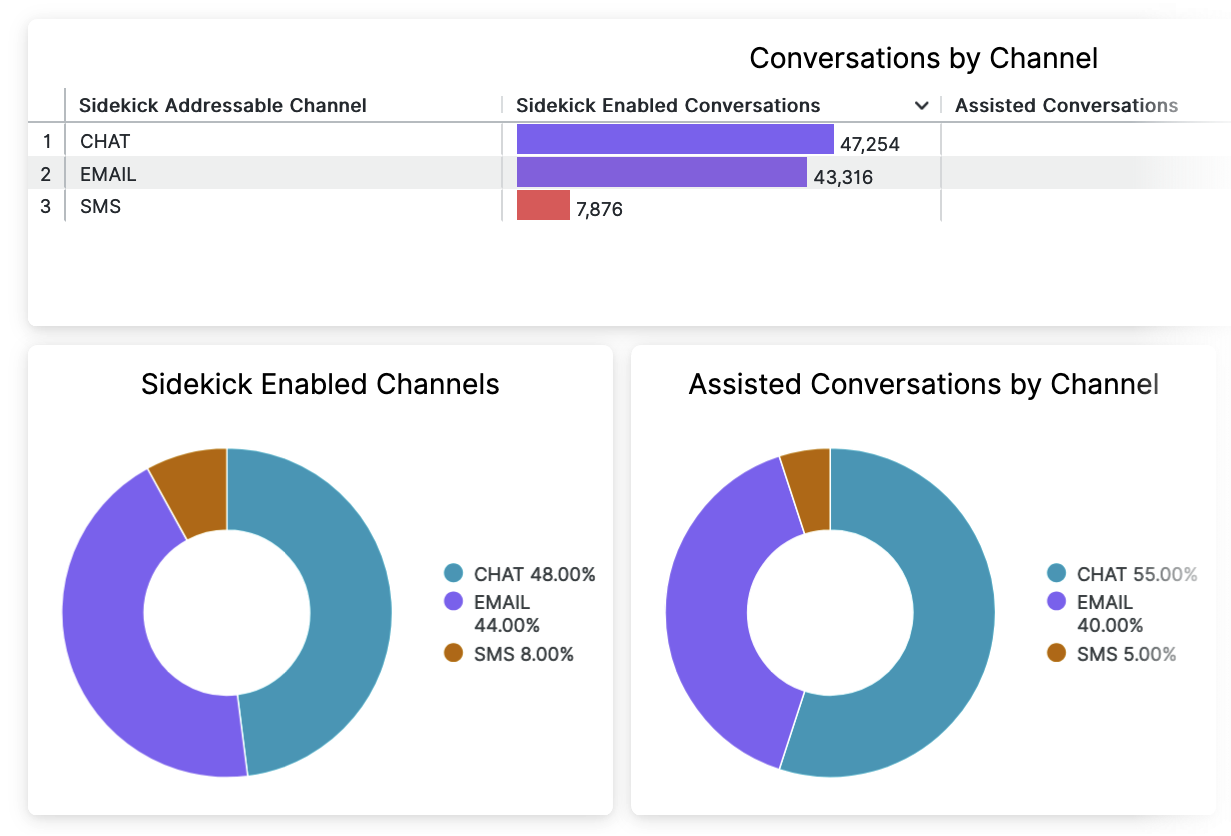
Channel-specific graphs enable you to identify Channels that are under or over-performing relative to the volume of Conversations where Sidekick could be used.
Example
A Channel, such as Chat, accounts for a disproportionate amount of Resolutions relative to the volume of Sidekick-eligible Conversations. This insight could signal an opportunity to apply what’s working well with Chat to other Channels.
2. Prioritize addressing your most common Contact Reasons
Data dedicated to showing the top Contact Reasons for your organization allows you to see how Sidekick classifies conversations that it assists.
Example
Using the power of Gladly’s reporting tool, you can drill down into the specifics of your most common Contact Reasons to review examples of specific Conversations and diagnose opportunities to improve the underlying Threads, or the Answers, that are the basis for those Threads.


3. Identify areas to improve
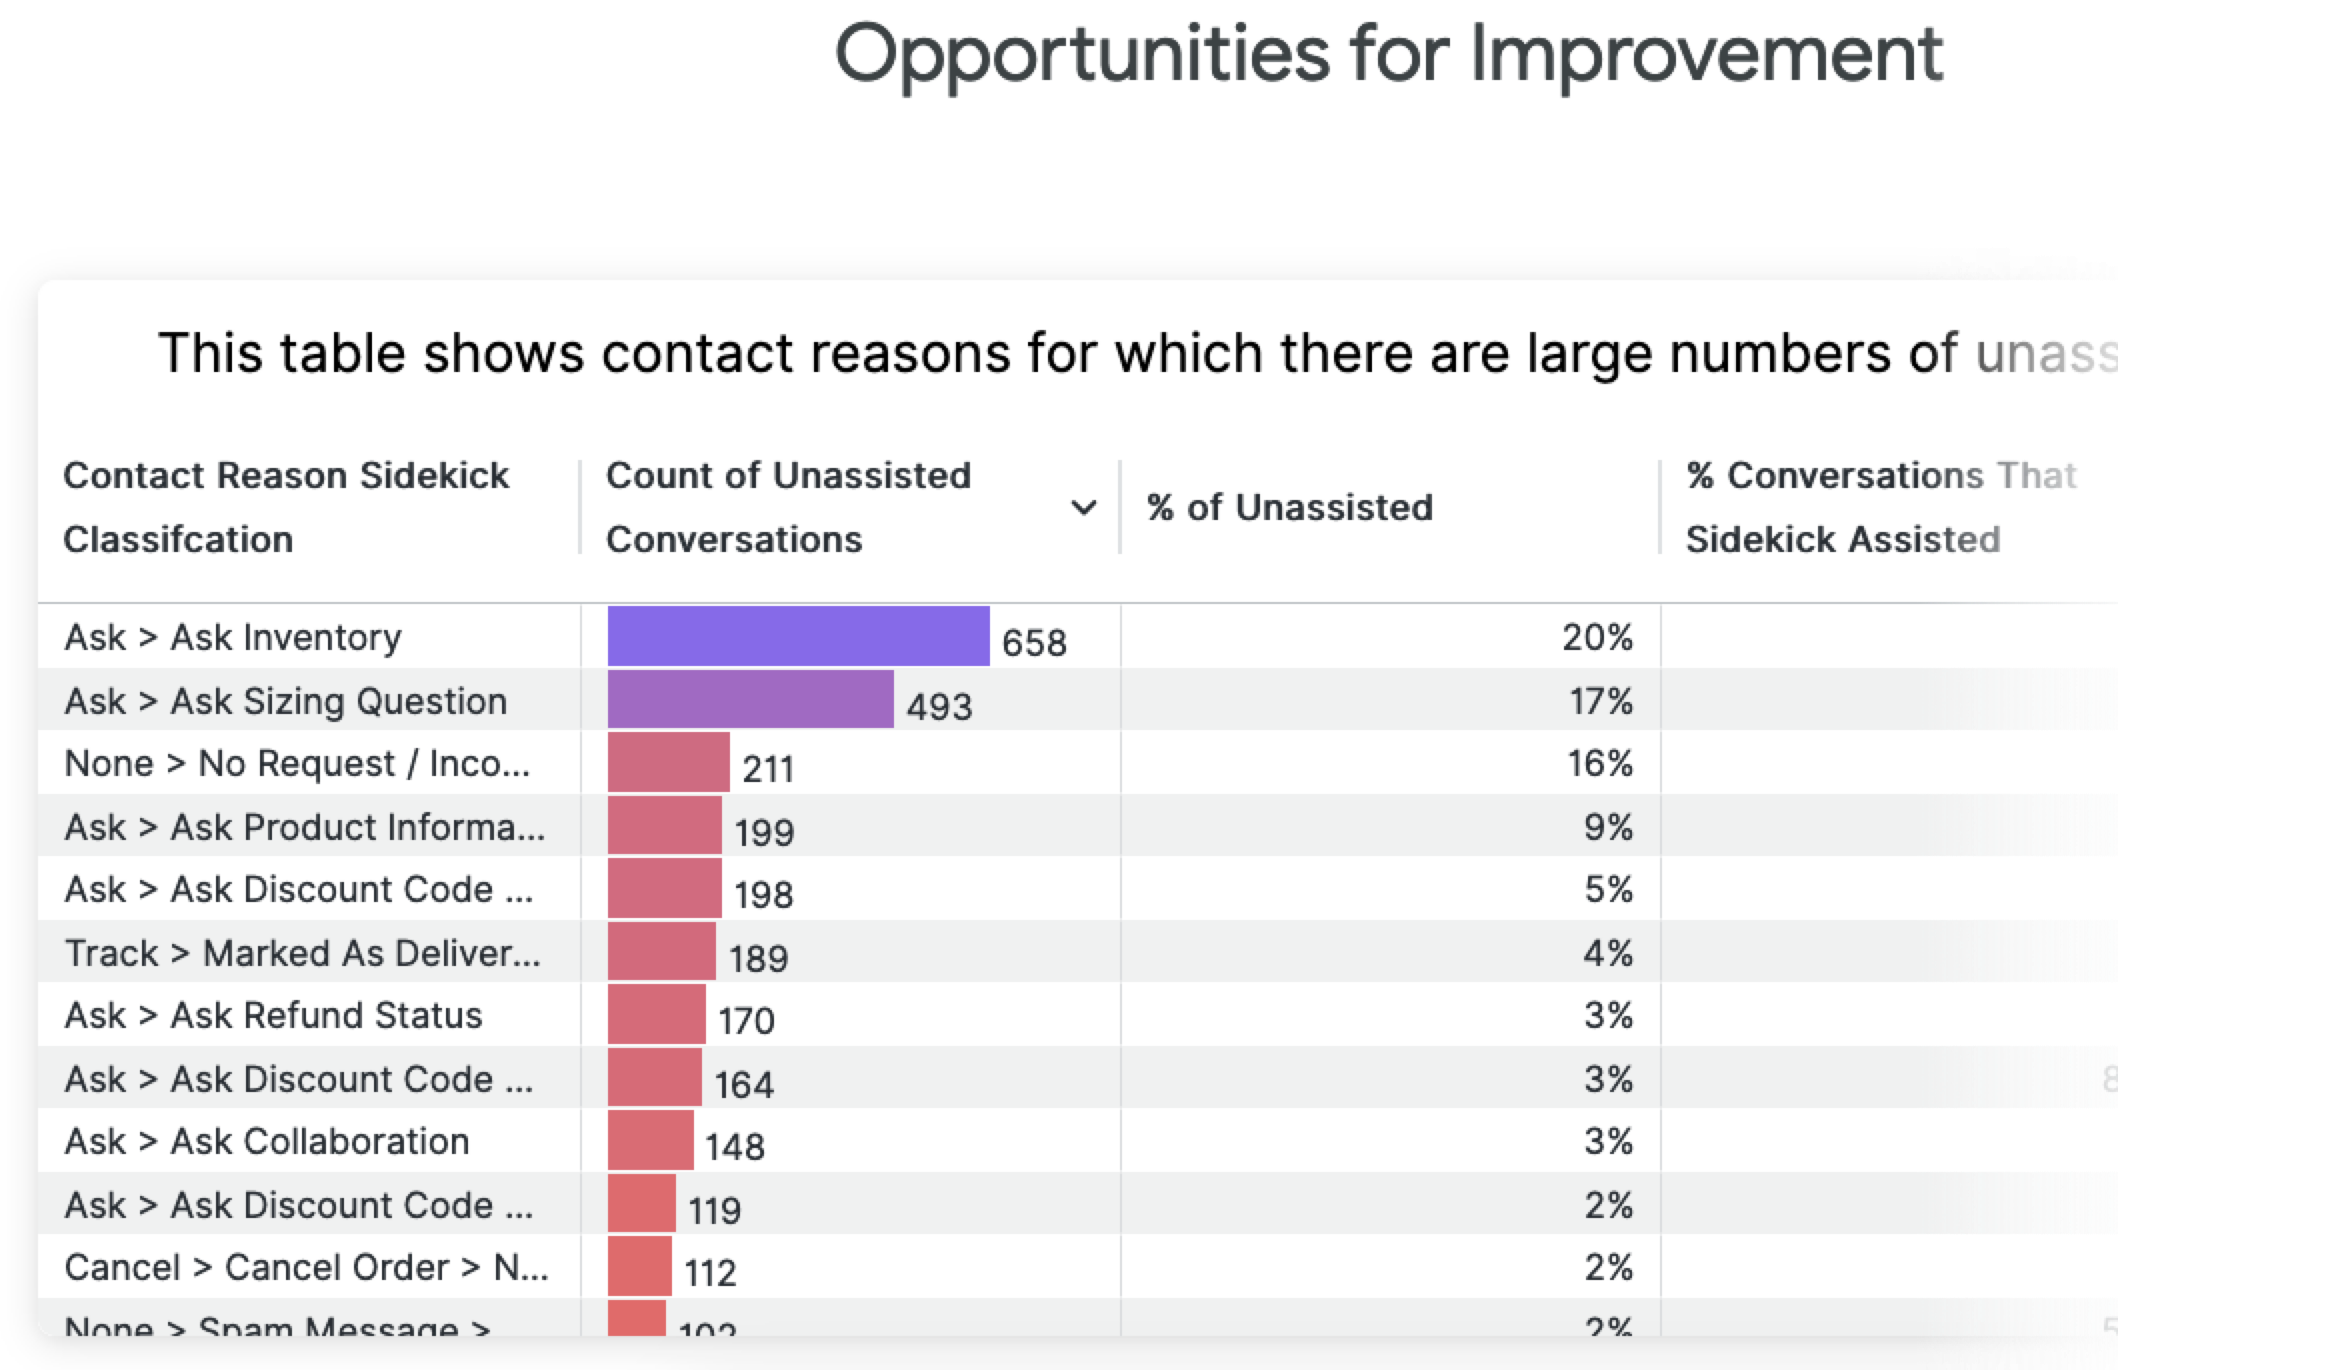
The Dashboard surfaces the top reasons that result in an unassisted Conversation, giving you the tools to directly improve your Customer experience.
Example
You determine that more frequent contact reasons have relatively low median handle times and, therefore, would not be as helpful for Sidekick to Assist or Resolve as other contact reasons with significantly longer median handle times.


