| REQUIRED USER ROLE Analyst |
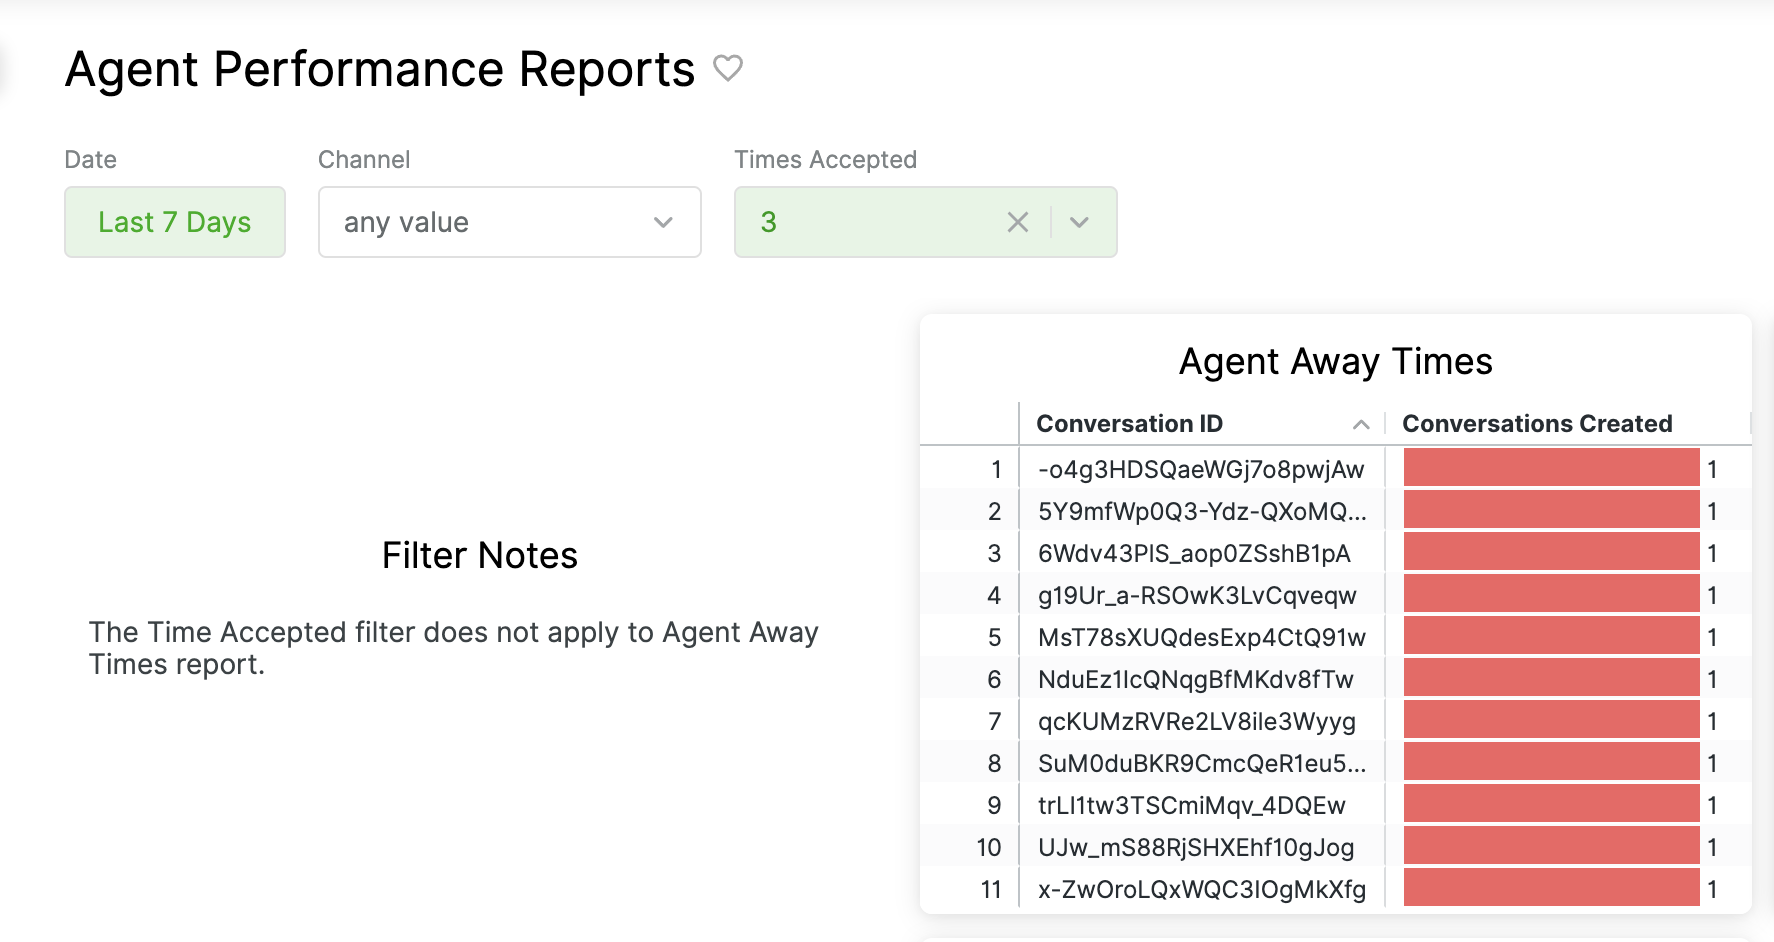
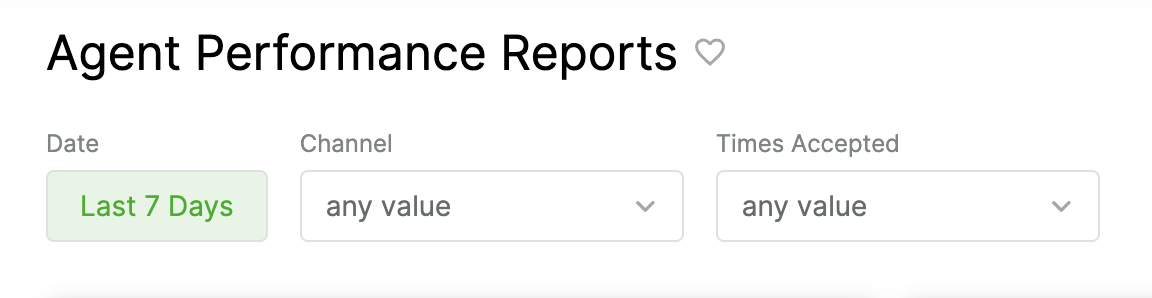
Give non-analyst users (e.g., Team Managers, Administrators) the ability to apply different filters to reports on a dashboard without changing the original filters applied to the report. This way, other users can apply different dimensions to the report to answer a question. For example, suppose you have an Average Contacts per Agent report to see the average number of Contacts per Agent for the last seven days. In that case, you can add a date filter in the dashboard to allow non-analysts to filter by other date ranges (i.e., seven days, 14, days, 30 days) instead of just seeing data for seven days. Configured filters appear above the dashboard.
Dashboard filters can be configured to apply to all the reports in the dashboard (if the filter is available for the dataset) or for a specific report.
Datasets and filters #
You may have a mixture of reports using different datasets in a dashboard. If you do, the filters available for each report depend on the dataset, which means not all filters may apply to all reports. When you select a metric to filter, you’ll see which reports the metrics can be applied to.
Add filter to reports for dashboard users #
- From the Reports page, click Create a Report and select any dataset.
- From the blank Explore, click the folder icon on the right side of the page, click Group, then click the dashboard where the report is saved.
- When the dashboard opens, click the kebab icon (three dots) on the top-right corner of the page, then click Edit dashboard.
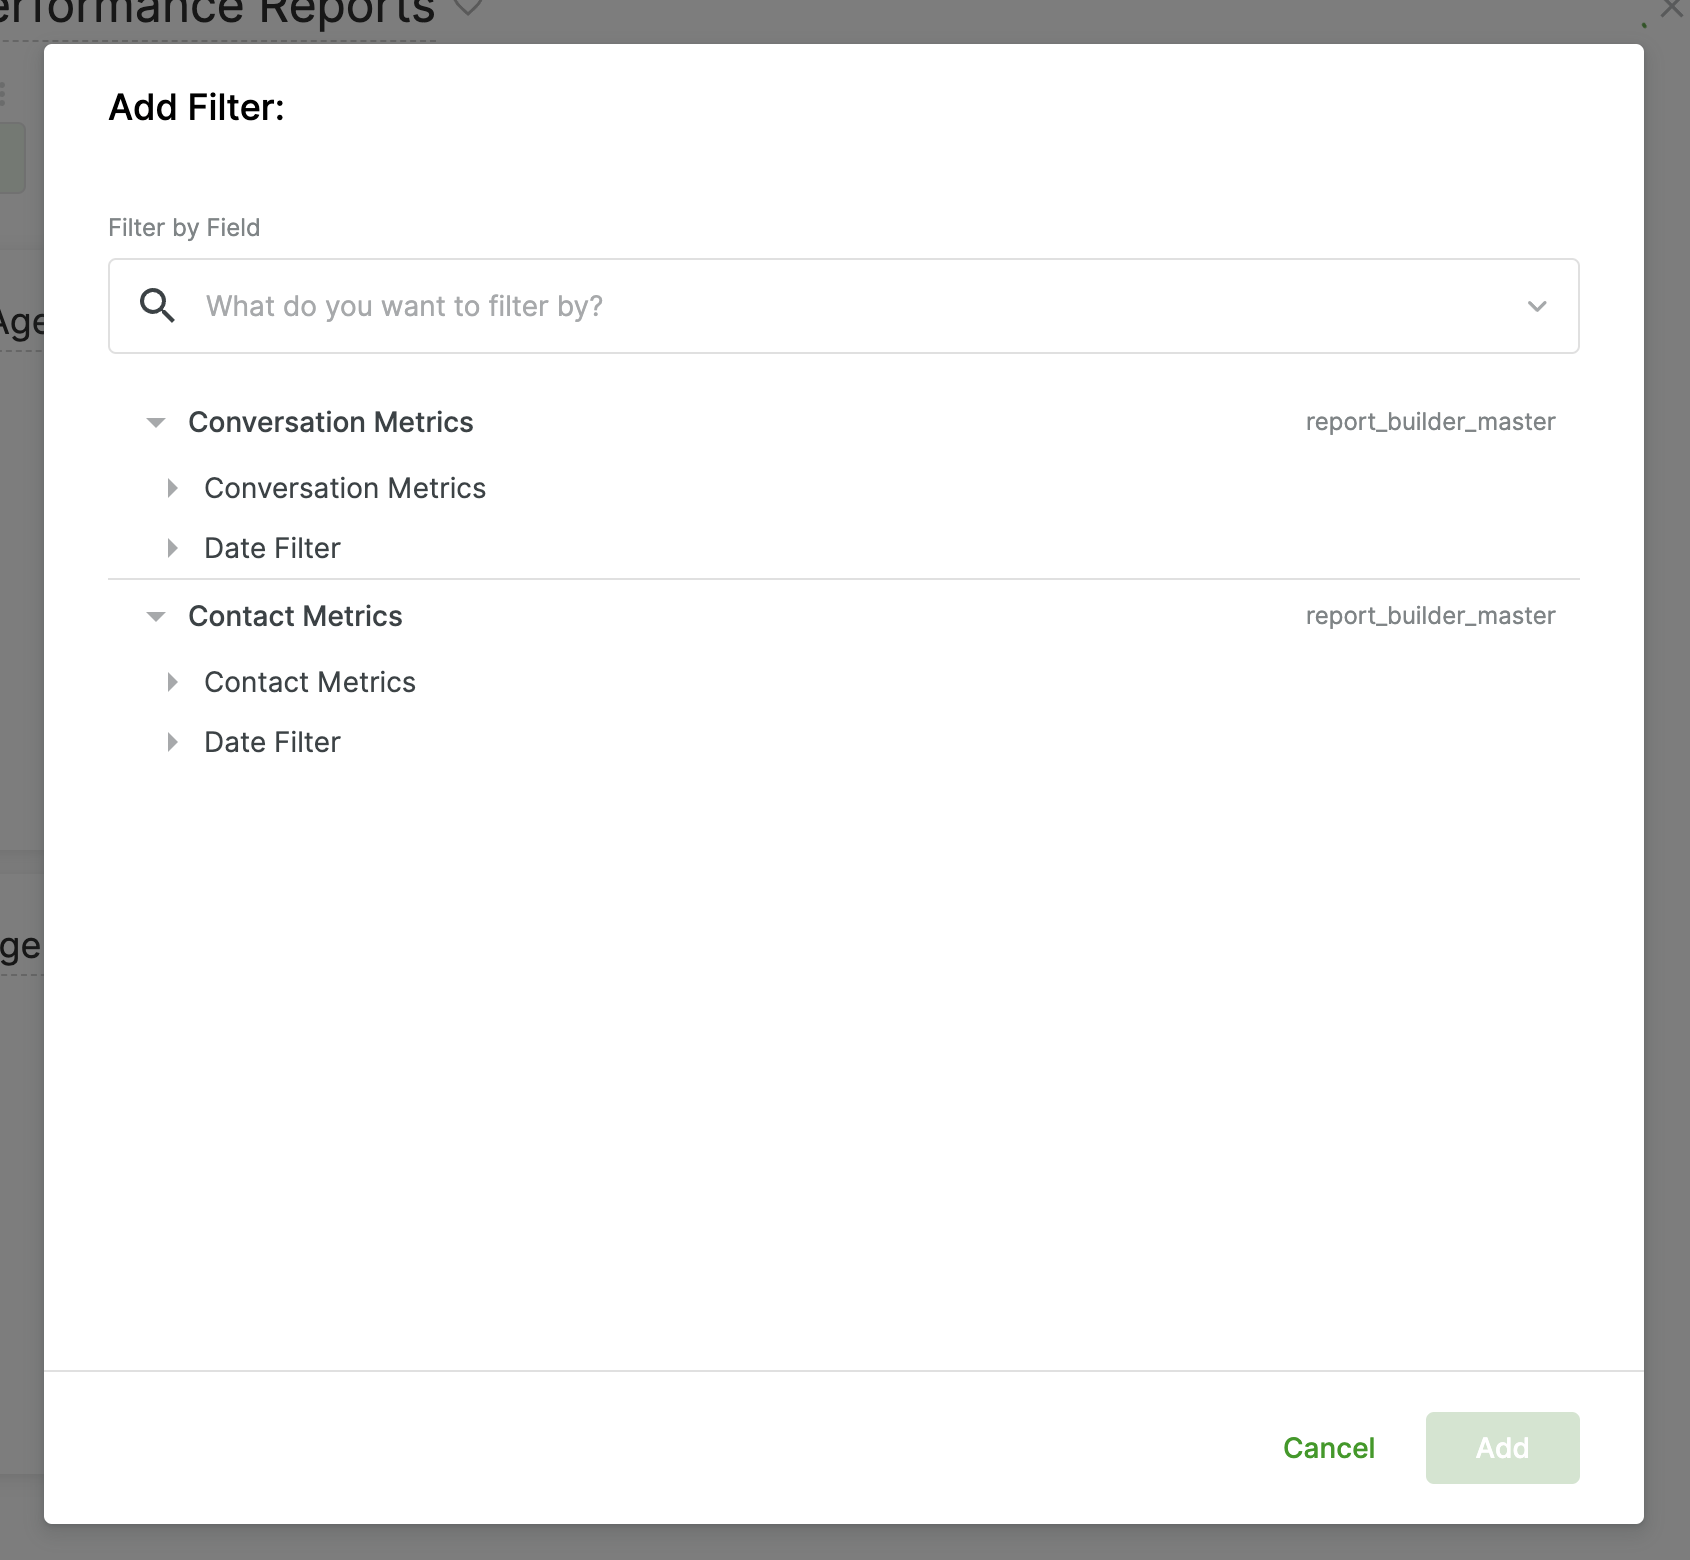
- Click Filters above the dashboard, then Add Filter.
- The Add Filter shows a list of datasets for reports in the dashboard.

- Search and select the filter you want available to non-analyst users.
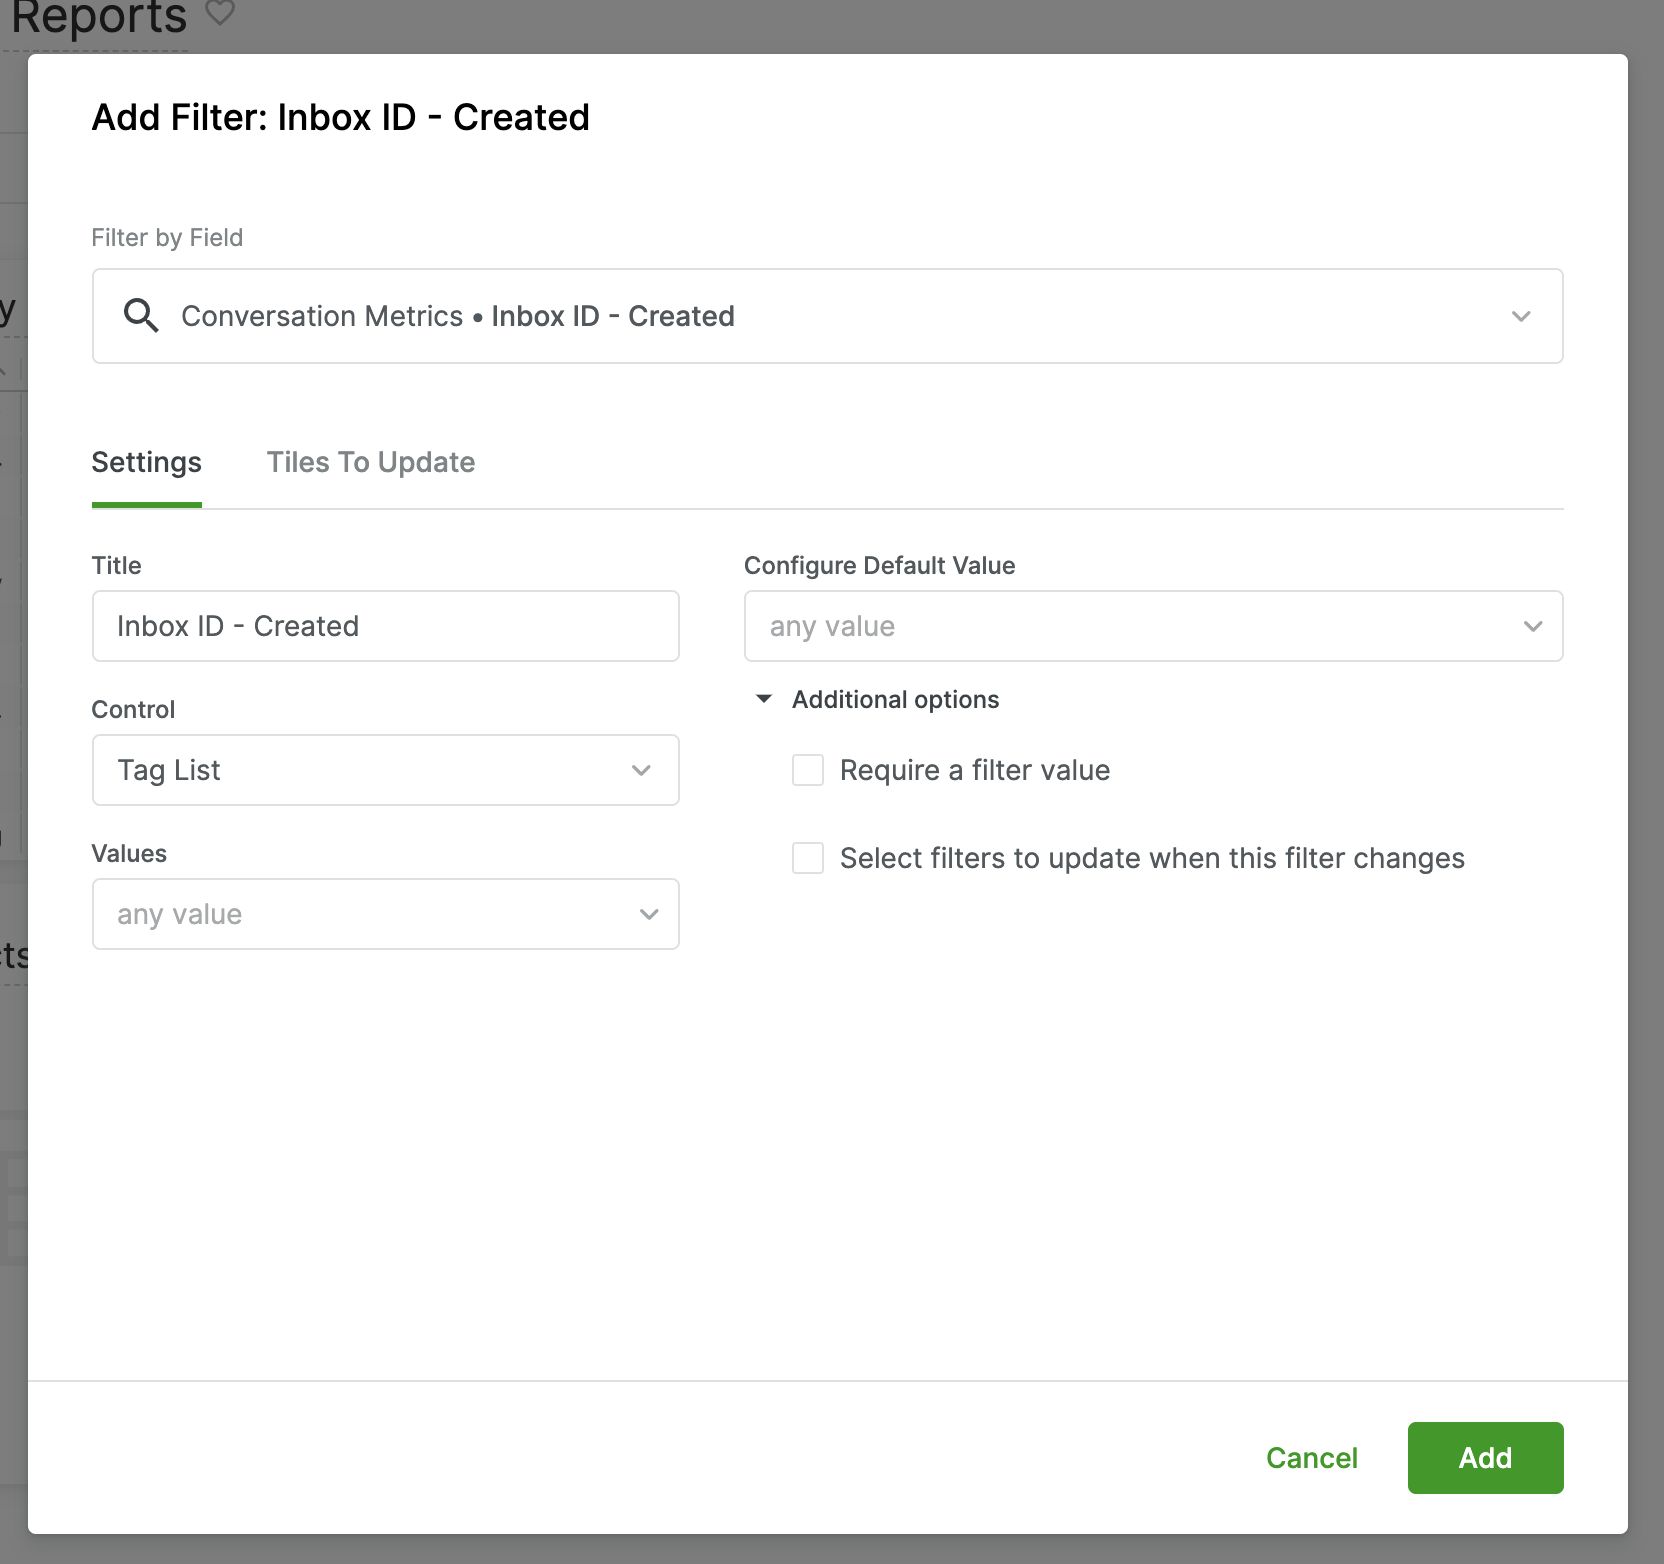
- From the filter configuration window, customize your filter settings.
- See Adding dashboard filters for a detailed look at how to edit filters.
- Note – Filter configuration options vary depending on the metric you have selected.
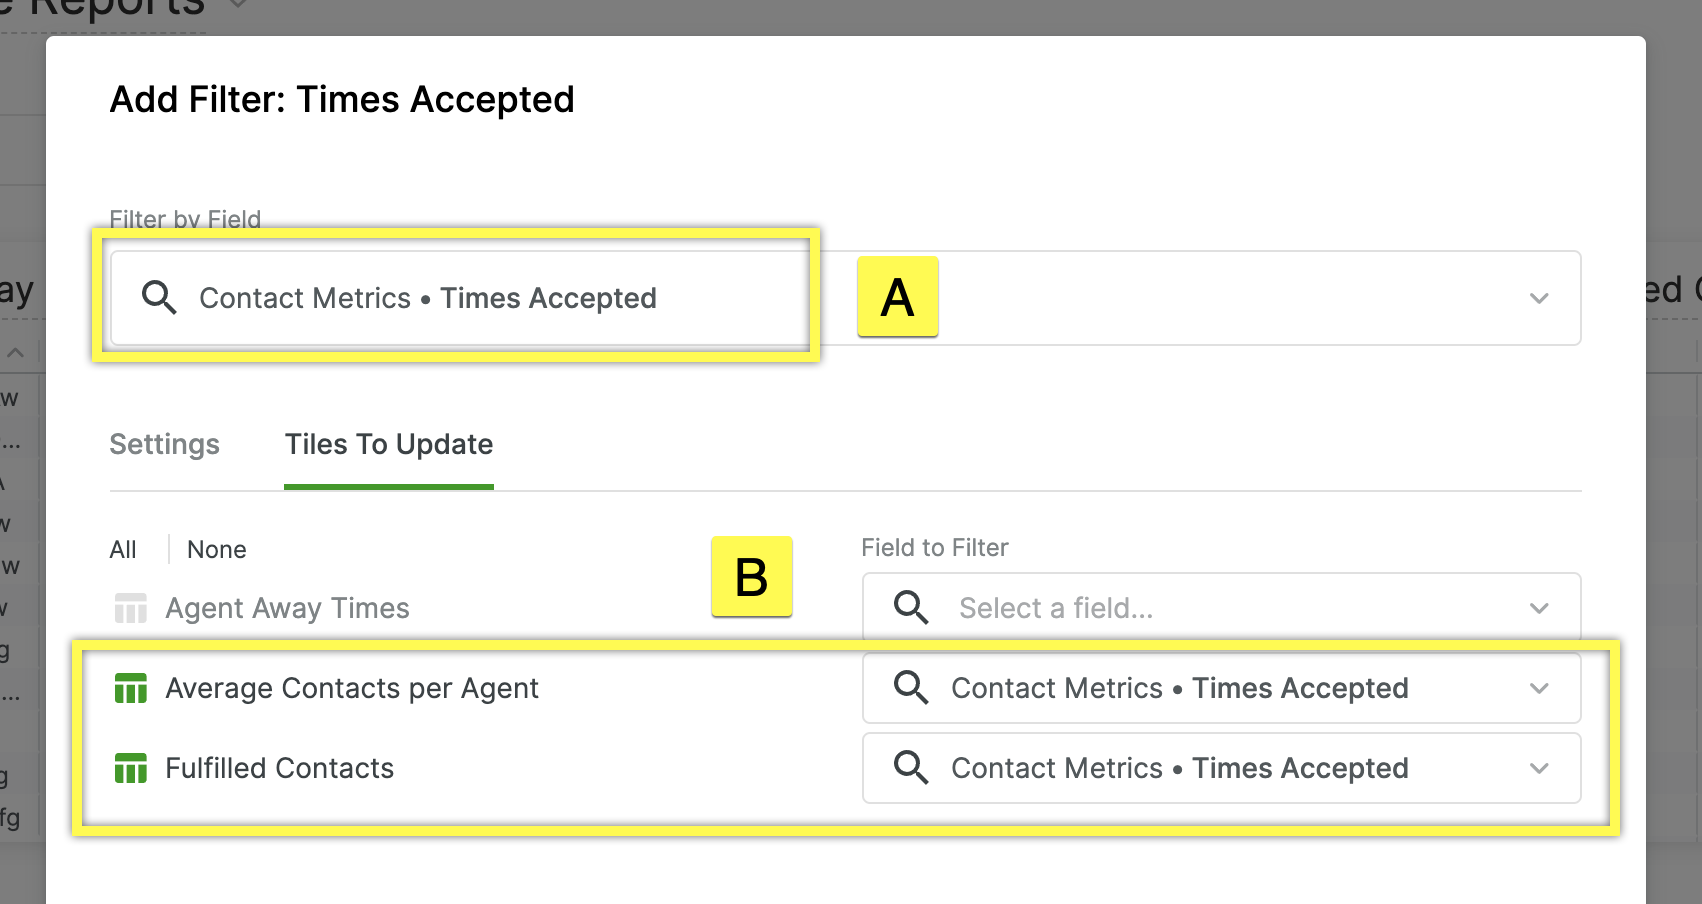
- Click Tiles To Update. This setting allows you to which report in the dashboard the filter applies to.
- Reports in the dashboard that the metric is compatible with appear with a green icon to change the filter for the field.
- Incompatible reports appear gray, and the filter cannot be used.
- [A] – Selected metric to filter by.
- [B] – Metric compatible reports.
- Click Add to save the filter, then click Save in the dashboard.
- Filters are made available to non-analyst users on the dashboard.
Edit an existing dashboard filter #
While the dashboard is in edit mode, click the kebab icon (three dots) next to a filter, then click Edit.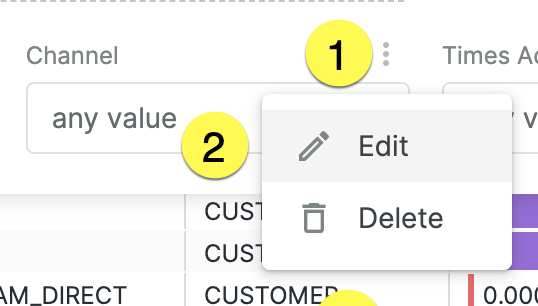
Filter view and placement #
Choose to have dashboard filters available to non-analyst users to appear collapsed/expanded and on the top/right side of the dashboard.
- While the dashboard is in edit mode, click Settings above the dashboard.
- From the Settings page, click the Filters tab.
- Default filters view – Select whether to have dashboard filters appear Expanded or Collapsed when the dashboard is opened.
- Filters location – Select whether to have dashboard filters appear on the Top side of the Right side of the dashboard.
- Click Save.
Use Text tile to add notes #
Use the Text feature to add notes about the dashboard you want others to be aware of. For example, add a note to call out that some filters may not apply to every report in the dashboard. Text appears as a tile in the dashboard.
- From the Reports page, click Create a Report and select any dataset.
- From the blank Explore, click the folder icon on the right side of the page, click Group, then click the dashboard where the report is saved.
- Click the kebab icon (three dots) on the right page when the dashboard opens, then click Edit dashboard.
- Click + Add Tile above the dashboard, then Add Text
- Enter the Title, Subtitle (optional), and body.
- Click Save to save the tile, then click Save in the dashboard.